
Fig. 2.
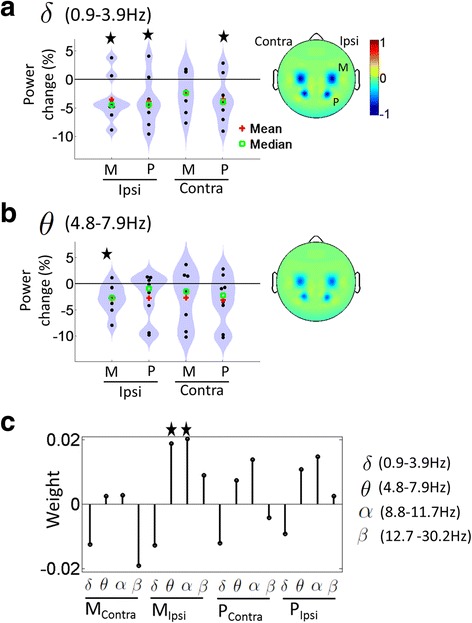
Distribution of percentage change in mean resting state EEG power across the eight subjects, pre to post intervention, within the (a) delta frequency band and (b) theta frequency band with head plots depicting 1/coefficient of variation (mean/standard deviation) of group level percentage changes. Star sign represents a significant change in group level resting state EEG power from zero. c Magnitude of the coefficients of the multivariate robust ridge model from regressing mean FCI changes to mean power changes, pre to post intervention, with the star sign depicting coefficients whose absolute magnitude were greater than 95% of those produced by random data permutation. M: electrodes over Motor cortex; P: electrodes over Parietal cortex