
Fig. 2.
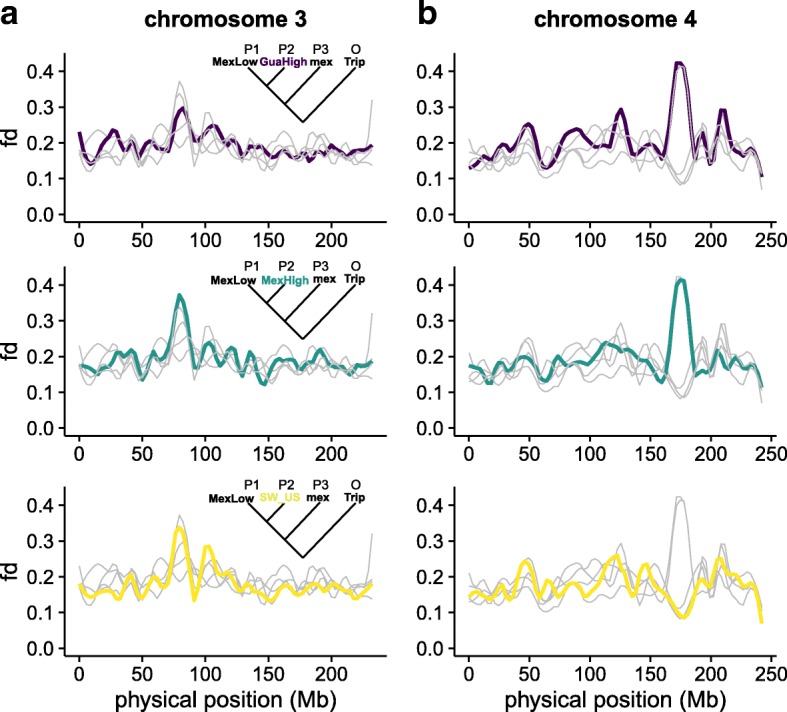
Introgression from mexicana into maize landraces. Loess regression of is plotted for all five populations on a chromosome 3 and b chromosome 4. Each plot highlights a single population, with other populations shown in gray. The Mexican lowlands population is used as a reference and thus not plotted. No significant introgression was detected in the South American lowlands or the Andes, and loess regressions for these populations are only shown as gray lines. The statistic was calculated based on the tree in which P2 is varied across populations. mex mexicana, Trip Tripsacum