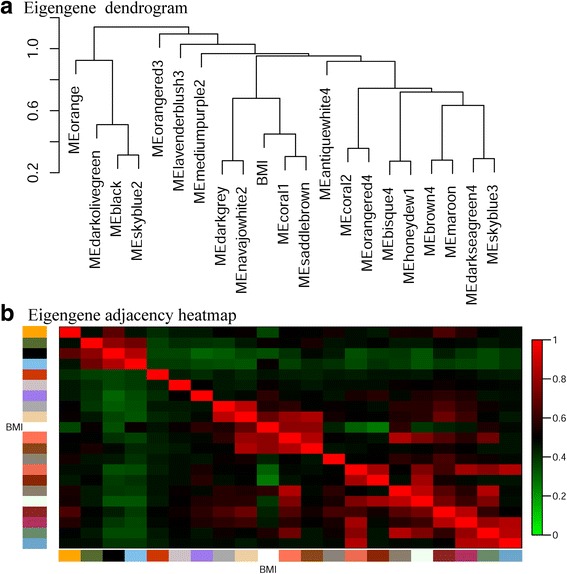
Fig. 4.

Relationships among modules. a Hierarchical clustering of module eigengenes that summarize the modules found in the clustering analysis. Branches of the dendrogram (the meta-modules) group together eigengenes that are positively correlated. b Heatmap plot of the adjacencies in the eigengene network including the trait of interest-BMI. Each row and column in the heatmap corresponds to one module eigengene (labeled by color) or BMI. In the heatmap, red represents high adjacency, while blue color represents low adjacency. Squares of red color along the diagonal are the meta-modules
