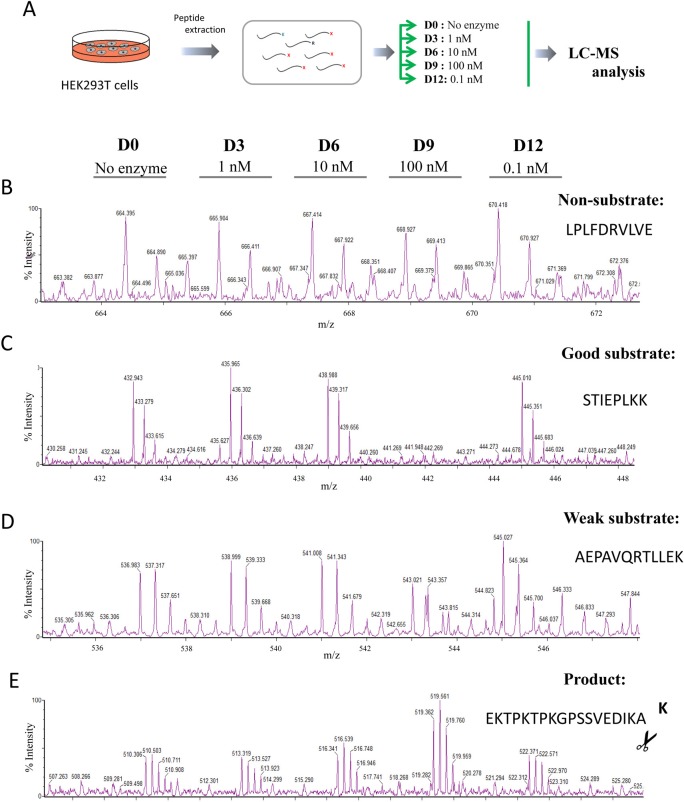
Fig 8. Quantitative peptidomics scheme for the study of rhCPD substrate specificity using HEK293T derived peptide library and representative spectra.
(A) Quantitative peptidomics scheme. Peptides were extracted from HEK293T cell cultures treated for 1 h at 37°C with 0.5 μM bortezomib. The resultant peptide extract (i.e., HEK293T peptidome) was aliquoted and digested with no enzyme or different rhCPD concentrations (i.e., 0.1, 1, 10, and 100 nM at 37°C for 16 h). After incubation samples were labeled with one of five stable isotopic TMAB-NHS tags (D0 = No enzyme; D3 = 1 nM; D6 = 10 nM; D9 = 100 nM; and D12 = 0.1 nM). Then, samples were pooled and analyzed by LC-MS. Examples of representative data are shown for (B) non-substrates, (C) good substrates, (D) weak substrates and (E) products.

