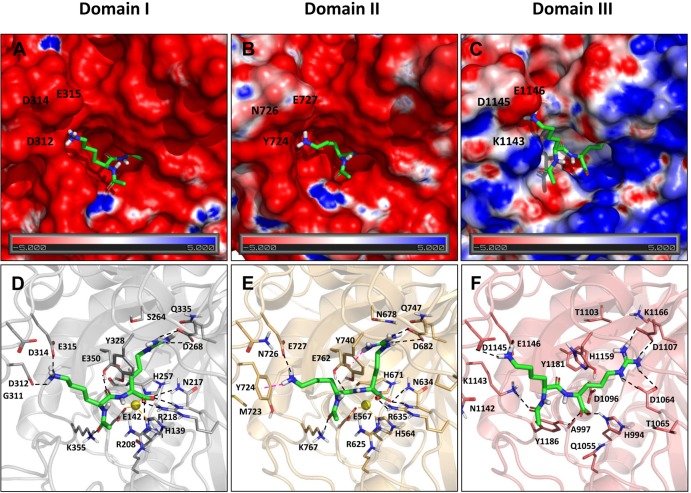
Fig 10. Structural modeling of the active sites of CPD domains I, II and III.
Electrostatic potential molecular surfaces of the catalytic sites of CPD domains I (A), II (B) and III (C) in presence of a modeled peptide. Lower panels show the best docking pose based on GlideScore for the truncated peptide GQKR (green sticks) within the active sites of domains I (D), II (E), and III (F), with the two last N-terminal residues omitted for clarity. Zn coordinates (yellow sphere) are added from the template structure used for modeling (PDB 1H8L). Hydrogen bonds are depicted in black dashed lines, π-cation interactions in pink and metal coordination in orange dashed lines. Within lower panels, the side chains of residues directly involved in the zinc binding are shown (i.e., His69, Glu72 and His196 using bCPA1 numbering; corresponding to His139/564, Glu142/567, and His257/671 in CPD domains I/ II), as well as the catalytic residue Glu270 (Glu350/762 in CPD domains I/II). In addition, the side chains of some of the putative residues determining respectively the S1’ and S1 specificity pockets are shown for domains I/ I; i.e., Arg218/635 (corresponding to Arg145 of bCPA1 numbering); Tyr328/740 (Tyr248 of bCPA1); and Gln335/747 (Ile255 of bCPA1). See S3 Fig for other residue equivalences.

