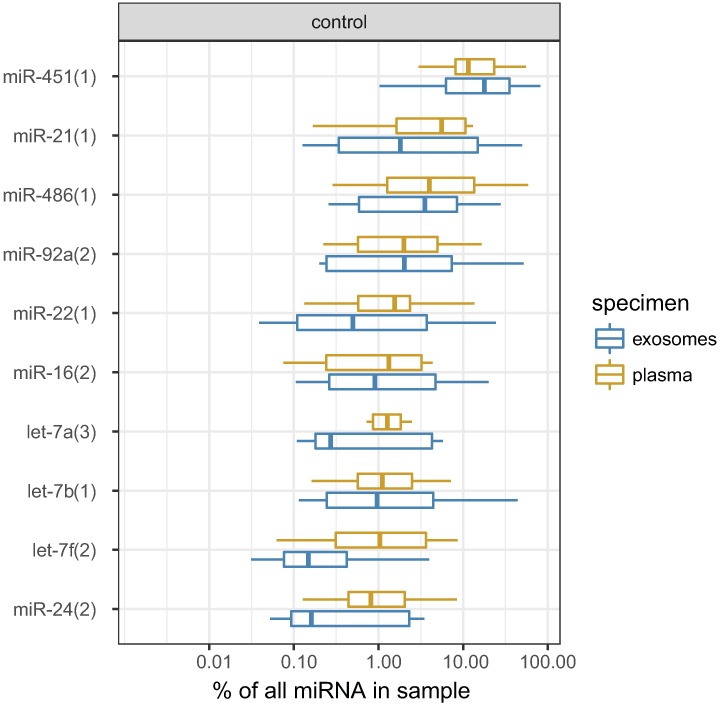
Fig 1. Box plots showing levels of top 10 miRNA in healthy controls' plasma and corresponding levels in paired exosome preparations.
Statistically differences between plasma and exosomes are not significant, as inferred from a DESeq2 analysis presented in Table A in S2 File.

