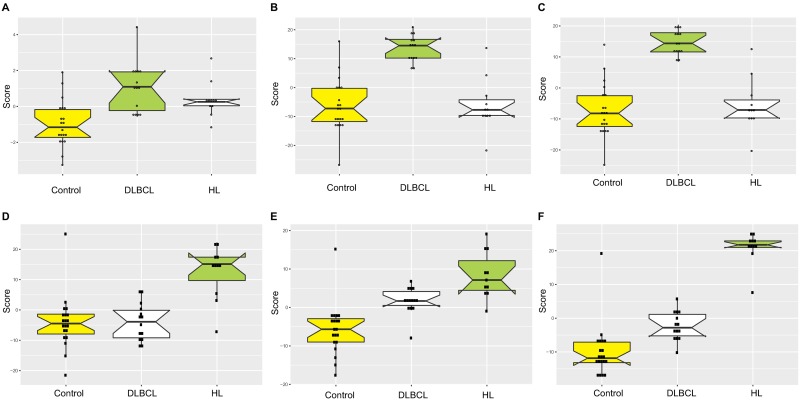
Fig 4. Box plots showing the distribution of composite scores based on the levels of differentially expressed miRNA between DLBCL patients and healthy volunteers (A-C) or between HL patients and healthy volunteers (D-F).
Scores are composed of up-regulated miRNA (A and D), down-regulated miRNA (B and E) or all dysregulated miRNA (C and F) in the respective pairwise analysis; however, all 3 groups of patients are shown in all plots. The composite scores were calculated for each patient by standardizing miRNA levels (namely, scaling the average level of each miRNA to 0 and standard deviation of 1) and summing the respective miRNA. Upregulated miRNAs were added to the score sum, while downregulated miRNA were subtracted.

