
Fig 6. Data-driven estimation of hemispheric lateralization of cognitive function.
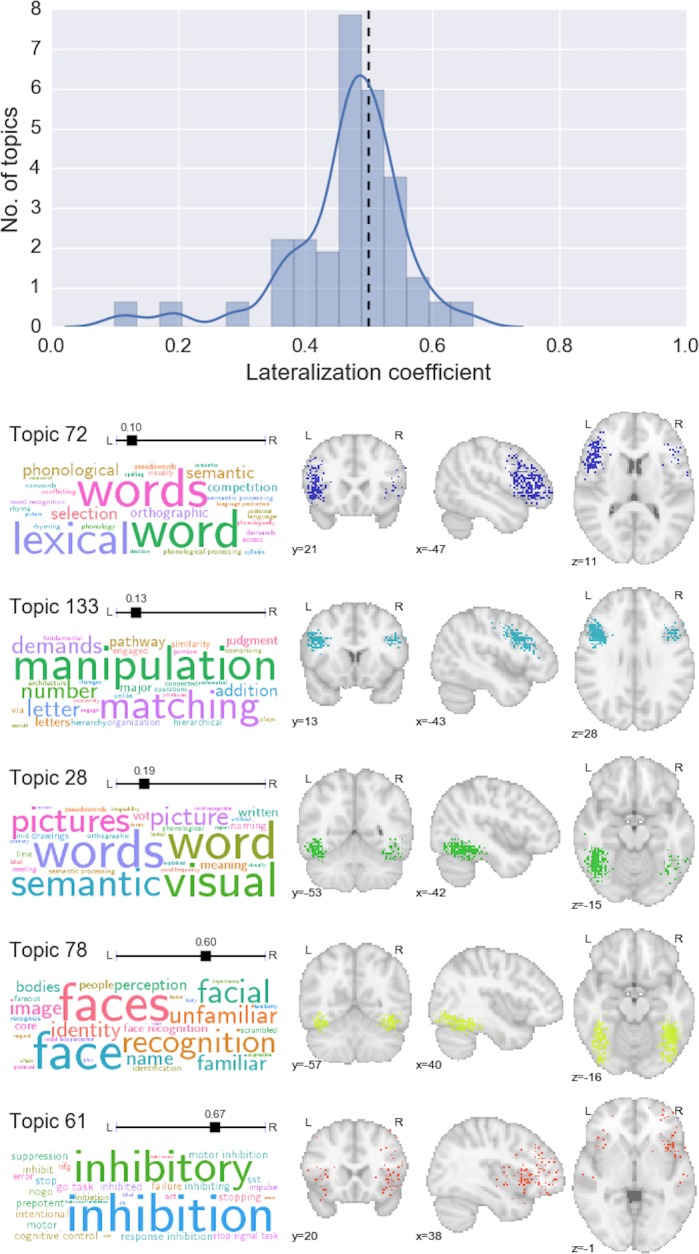
Top: histogram and kernel density estimation plot of the lateralization coefficient for all topics. Values below 0.5 represent left-lateralization; values above 0.5 represent right-lateralization. Bottom: selected topics that displayed notable hemispheric lateralization.