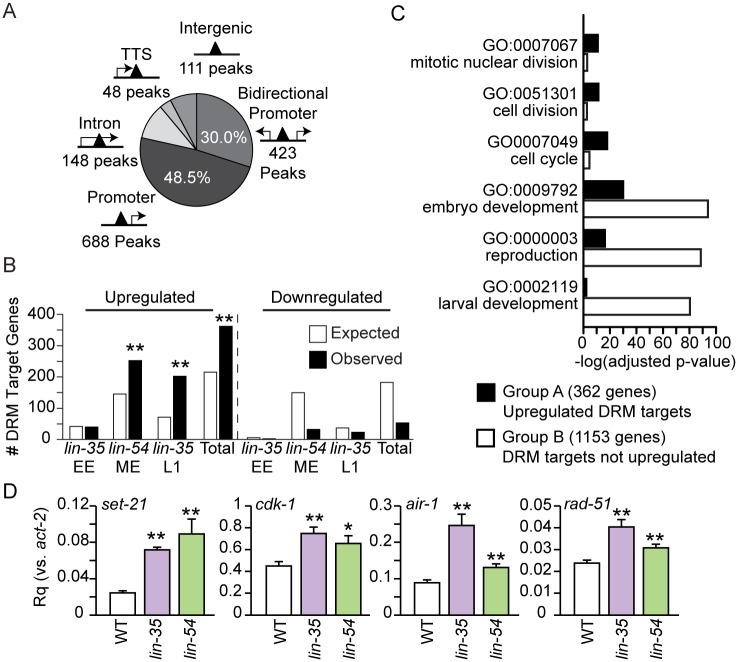
Fig 4. Locations of DRM peaks and misregulation of DRM target genes.
(A) Pie chart showing the number of peaks within a promoter (-1000 bp to +100 bp) of bidirectional gene pairs (423 peaks) or single genes (688 peaks); within an intron (148 peaks); at the transcriptional termination site (TTS, 48 peaks); or intergenic (> 1000 bp from a gene, 111 peaks). The percentage of total peaks is indicated for promoter peaks only. (B) Enrichment analysis of DRM target genes expected and observed among genes up- or downregulated in microarray expression analyses reported in [37] (lin-35 early embryos (EE) and L1s) and [33] (lin-54 mixed-stage embryos (ME)) and a combination of all 3 experiments (Total). The significance of enrichment observed over expected was determined using a hypergeometric distribution (** p-value < 1x10⁻⁵). (C) Bar chart plotting the –log10 Benjamini adjusted p-value of selected GO term enrichment observed for 362 upregulated DRM target genes (Group A, black) compared to GO term enrichment for 1153 DRM target genes not upregulated (Group B, white). (D) RT-qPCR analysis comparing transcript levels of 4 Group A genes (set-21, cdk-1, air-1, and rad-51) in lin-35(n745) (purple) and lin-54(n2231) (green) late embryos to the level in wild-type (WT, white) late embryos. Expression values from 2 independent experiments each consisting of 4 biological replicates were averaged and are presented as the relative quantity (Rq) compared to act-2. Error bars indicate standard error of the mean, and significance was determined by a student’s T test between transcript levels in mutant vs WT (* p-value < 0.05, ** p-value < 0.01). Additional genes are shown in S5 Table.

