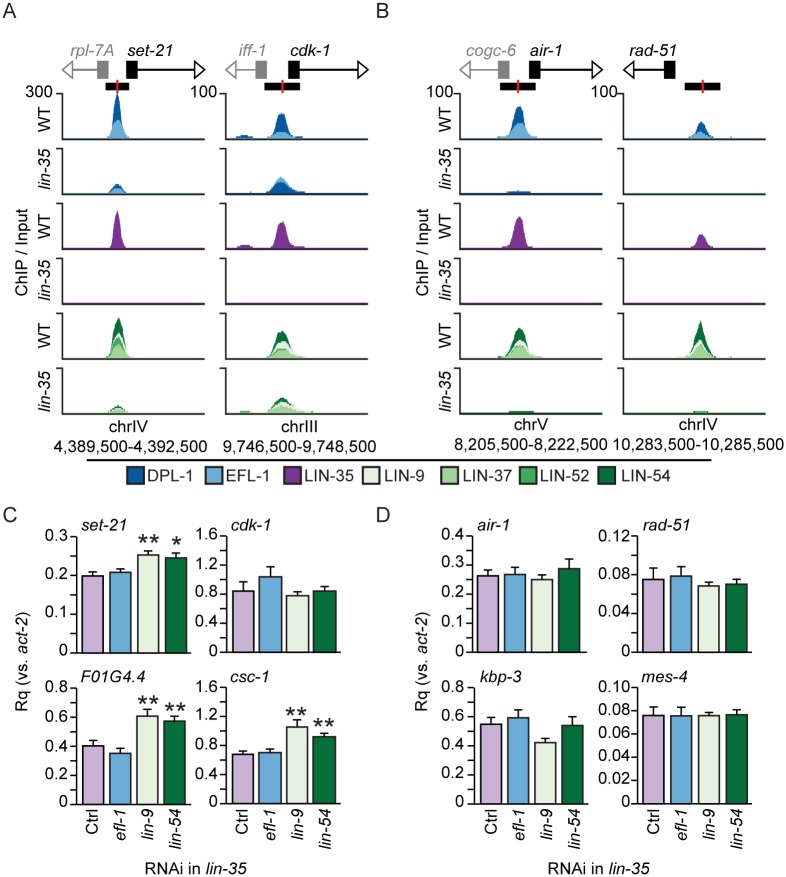
Fig 5. Effects of depletion of additional DRM subunits in lin-35 null mutants.
(A,B) Genomic profiles of each DRM component in wild-type (WT) and lin-35 late embryos near (A) set-21 and cdk-1 and (B) air-1 and rad-51. E2F-DP subunits (blues), LIN-35 (purple), and MuvB subunits (greens) were overlaid on the same track. Normalized ChIP-seq enrichment values for each data track are indicated on the y-axis, and the chromosomal coordinates of the areas shown are indicated below the x-axis. Gene transcriptional start sites are indicated by black boxes, and coding strand directions are indicated by white arrowheads. Other genes in the region are similarly indicated in grey. Each DRM peak location is indicated by a black rectangle with the peak center highlighted in red. (C,D) RT-qPCR analysis of (C) set-21, cdk-1, F01G4.4, and csc-1 and (D) air-1, rad-51, kbp-3, and mes-4 following efl-1 (blue), lin-9 (light green), or lin-54 (dark green) RNAi in lin-35 null late embryos compared to empty-vector RNAi (Ctrl, purple). Expression values from 2 independent experiments each consisting of 4 biological replicates for each RNAi condition were averaged and are presented as the relative quantity (Rq) compared to act-2. Error bars indicate standard error of the mean, and significance was determined by a student’s T test comparing DRM subunit RNAi to Control RNAi (Ctrl) (* p-value < 0.05, ** p-value < 0.01). Additional genes are shown in S5 Table.

