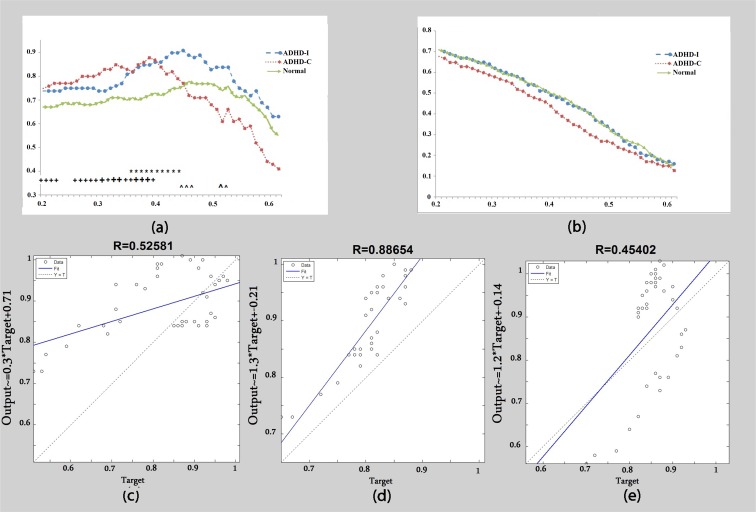
Figure 3.
Beta1 band: (a) Clustering coefficient calculated as a function of threshold. (b) Global efficiency calculated as a function of threshold. (c) The correlation of clustering coefficient graphs between the ADHD-C group and ADHD-I group. (d) The correlation of clustering coefficient graphs between the control group and ADHD-I group. (e) The correlation of clustering coefficient graphs between the control group and ADHD-C group.
+ Significant difference between the control group and ADHD-C group.
* Significant difference between the control group and ADHD-I group.
^ Significant difference between the ADHD-C group and ADHD-I group.
Big signs: P<0.01.
Small signs: P<0.05.

