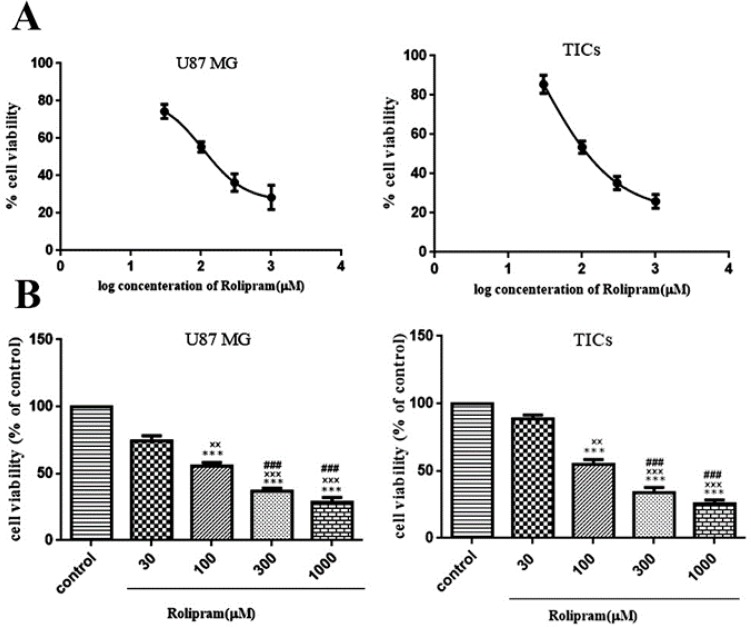
Figure 2.
The MTT assay results and effects of indicated concentrations of rolipram on the cell viability are presented. (A) By using prism graph pad 6, the curves of log IC50 of rolipram in the U87 MG cells and TICs are illustrated. (B) The results of 1-way ANOVA analysis to compare fold differences of mean normalized % viability values among various concentrations of rolipram together and relative to control (DMSO) in U87 MG cells and TICs. Bars represent fold differences of mean normalized % viability values±SEM (n=4). ***P<0.001 compared to corresponding control, ×××P<0.001, ××P<0.01 compared to concentration 30 μM of rolipram, ###P<0.001 compared to concentration 100 μM of rolipram.

