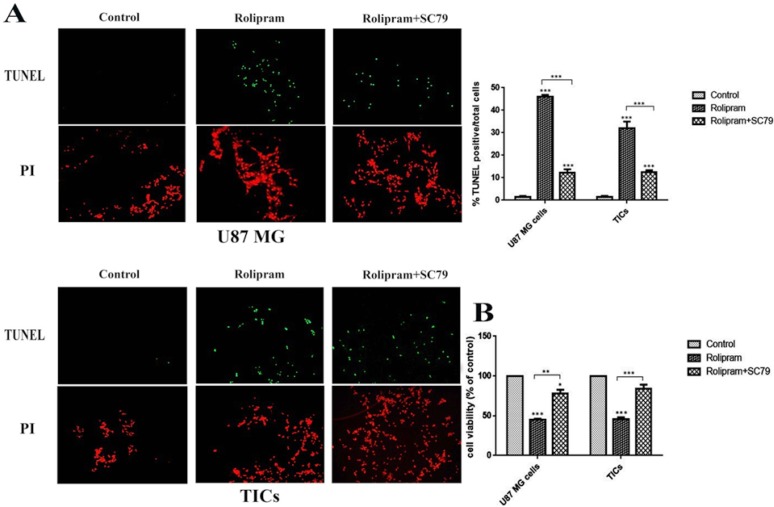
Figure 4.
Apoptosis (A) and viability (B) rates in U87 MG cells and TICs treated with rolipram at IC50 in the absence or presence of SC79 (4μg/mL) and DMSO as control for 48 h. (A) TUNEL (green) and PI (red) positive cells were visualized at wave length of 540 and 580 nm, respectively. Bars represent mean % apoptosis values±SEM (n=4). ***P<0.001 compared to control. (B) Bares represent fold differences of mean normalized % viability values±SEM (n=4). One-way ANOVA and Tukey post hoc test were used.*P<0.05, **P<0.01, ***P<0.001 compared to control.

