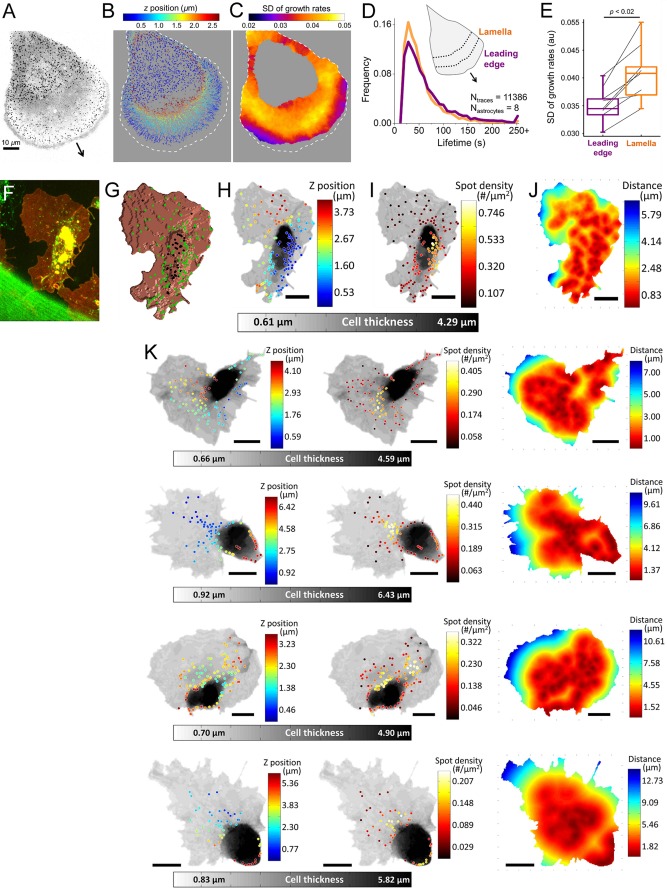
FIGURE 4:
Heterogeneous CME during in vitro and in vivo cell migration. (A) Maximum z-projection image shows clathrin-coated structures at the ventral and dorsal surfaces of an U373 astrocyte expressing AP2-GFP. The arrow points toward the direction of extension. (B) Clathrin coat traces obtained from the cell in A are color-coded according to their z-position relative to the substrate. (C) Growth rate map of the dorsal surface is created by calculating the SD of clathrin growth rates within a 4.8-µm radius. SD values are lower in the vicinity of the leading edge due to slower clathrin dynamics. Dashed lines represent the cell boundary. (D) Normalized distributions show lifetimes of dorsal clathrin coats positioned within an 8-µm neighborhood of the leading edge (indigo) and the dorsal coats positioned in the lamellar region between 8 and 16 µm from the leading edge (orange). (E) Box plots show the SD of growth rate distributions assembled using the leading edge and lamellar clathrin coat populations from eight astrocytes (Ntraces = 11,386). Connected lines indicate the values obtained from the same astrocyte. The narrower distribution obtained for the leading edge group (indigo) indicates slower clathrin dynamics at this region. Boxes extend to the quartiles, with a line at the median. Whiskers extend from the 10th to 90th percentiles. p value was obtained using the two-tailed t test. (F) Hemocytes expressing clathrin-GFP (green) and CD4-tdTomato (red) are imaged at the ventral surface of late Drosophila embryos. (G) CD4 signal is used to generate a 3D mask representing the surface of the hemocyte. Positions of the clathrin coats within 320-nm neighborhood of the surface are shown with green dots. (H, I) Grayscale represents the thickness of the hemocyte. Endocytic clathrin coats are color coded according to their z-positions in H and local density of clathrin spots calculated within a 5-µm cube in I. (J) Each pixel in the hemocyte image is color coded according to its average distance to the three closest clathrin coats. (K) Examples of hemocyte images highlighting the heterogeneous distribution of endocytic clathrin-coated structures. Scale bars in F–K are 8 μm.

