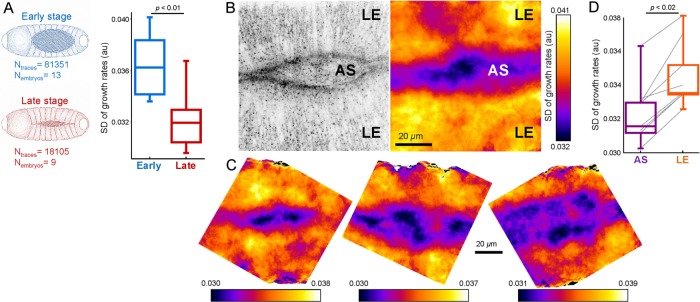
FIGURE 5:
Spatiotemporal variations in clathrin dynamics can be detected within tissues of Drosophila embryo. (A) Clathrin dynamics slow down with increasing tension during late stages of the dorsal closure. Box plots show the SD of clathrin growth rate distributions obtained from early and late stage AS tissues. Reduced SD is a hallmark of slowed-down endocytosis (Ferguson et al., 2016). (B) Left, clathrin-coated structures at the dorsal surface of a Drosophila embryo. AS appears as narrow opening between the two flanks of lateral epidermis (LE). Right, SD map of the clathrin growth rates obtained from the same area. The map is created by calculating the SD of apical clathrin growth rates within an 8-µm radius. Lower SD values in the AS region display slower clathrin dynamics with respect to the neighboring LE. (C) More examples demonstrating the heterogeneous clathrin dynamics at the dorsal surface of late Drosophila embryos. (D) Box plots show the SD of clathrin growth rate distributions obtained from LE and AS of eight embryos. Connected lines indicate the values obtained from the same embryo. Boxes extend to the quartiles, with a line at the median. Whiskers extend from the 10th to 90th percentiles. p values were obtained using the two tailed t test.

