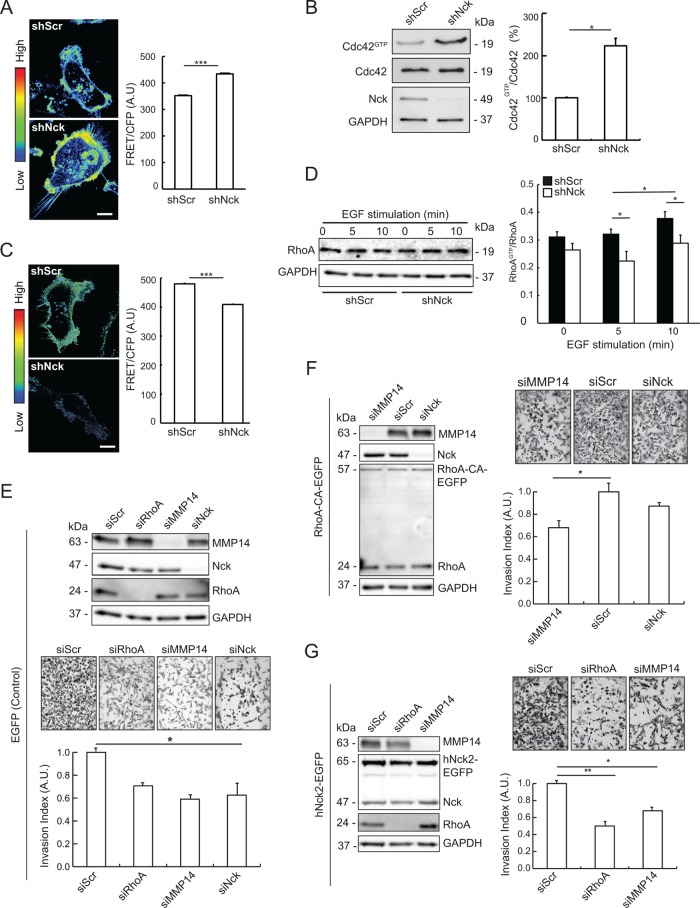
FIGURE 8:
Nck modulates the balance of Cdc42/RhoA activation and acts as an upstream regulator of RhoA-dependent, MMP14-mediated breast carcinoma cell invasion. (A) MDA-MB-231 cells expressing the Raichu Cdc42 FRET biosensor and either short hairpin (sh) RNAs encoding nontargeting sequences (shScr) or sequences targeting Nck (shNck) were plated on fibronectin in complete medium. Confocal time-lapse images of the ventral surface of the cells were acquired every minute for 30–60 min. The left panel shows representative FRET/CFP ratio images taken from time-lapse series. Images are presented using an intensity modulated display to associate intensity (activity) with color and hue (red = high activity; blue = low activity). Scale bar, 10 µm. The right panel shows quantitative analysis of FRET activity (mean ± SEM) in whole cells. FRET ratios were calculated for each cell in two to four fields (two to four cells per field) and every time interval (n = 642). Results shown summarize data from three independent experiments. ***p < 0.001. (B) Representative Western blots (left panel) showing GTP-loaded (active) Cdc42, total Cdc42, Nck, and GAPDH (loading control) levels in lysates from MDA-MB-231 stably expressing shRNAs encoding nontargeting (shScr) and Nck-targeting (shNck) sequences. Quantification of active Cdc42 is shown in the right panel. The intensity of bands corresponding to active Cdc42 (Cdc42GTP) was normalized to the intensity of the bands corresponding to total Cdc42 (Cdc42) and expressed as fold change relative to control shScr levels. Results summarize two independent experiments. *p < 0.05. (C) Cells expressing the Raichu RhoA FRET probe were cultured in complete medium and imaged every minute for at least 30 min. The left panel shows representative FRET/CFP ratio images taken from time-lapse series. Scale bar, 10 µm. The right panel shows quantitative analysis of RhoA FRET activity (mean ± SEM) in whole cells. FRET ratios were collected for each cell and every time interval (n = 947). Results shown summarize data from two experiments. ***p < 0.001. (D) Representative Western blots (left panel) showing RhoA and GAPDH levels in samples from control (shScr) and Nck-silenced (shNck) cells left untreated or stimulated with EGF. The right panel shows quantification of active RhoA. Levels of active RhoA (RhoAGTP) in extracts from starved cells left untreated (0 min) or stimulated with EGF (5 and 10 min) were determined by ELISA and values normalized to levels of total RhoA quantified by Western blotting. Results summarize two independent experiments. *p < 0.05. (E–G) MDA-MB-231 cells were transduced with viruses harboring vectors encoding (E) EGFP, (F) constitutively active EGFP-tagged RhoAQ63A (RhoA-CA-EGFP), or (G) wild-type EGFP-tagged human Nck2 (hNck2-EGFP). The newly created stable cell lines were subsequently transfected with control, nontargeting siRNA oligonucleotides (siScr), or siRNA oligonucleotides targeting RhoA (siRhoA), MMP14 (siMMP14), or Nck (siNck) as indicated. Cells were subjected to overnight starvation before seeding onto 8-µm-pore filters precoated with a laminin-rich matrix (Matrigel). Cells were allowed to invade for 10 h toward bottom chambers of transwell invasion plates loaded with complete medium. Panels E–G display representative Western blots showing cellular levels of target proteins or GAPDH (loading control), representative wild field images of migrated cells and quantitative analysis of relative migration. Bar graphs represent mean ± SEM (n = 3). *p < 0.05, **p < 0.01.

