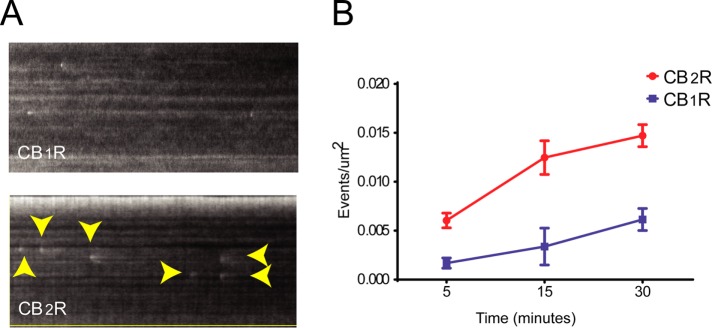
FIGURE 6:
CB2R recycling to the cell surface. (A) HEK cells stably expressing SEP-CB2R or SEP-CB1R were incubated with 10 µM 2-AG and imaged under TIRFM at time intervals as described under Materials and Methods. Kymographs depict single cells over time, where individual exocytic events are visible (arrowheads). (B) Individual exocytic events were quantified on multiple individual experiments and normalized to surface area (n = 10–12 cells).

