
Figure 2.
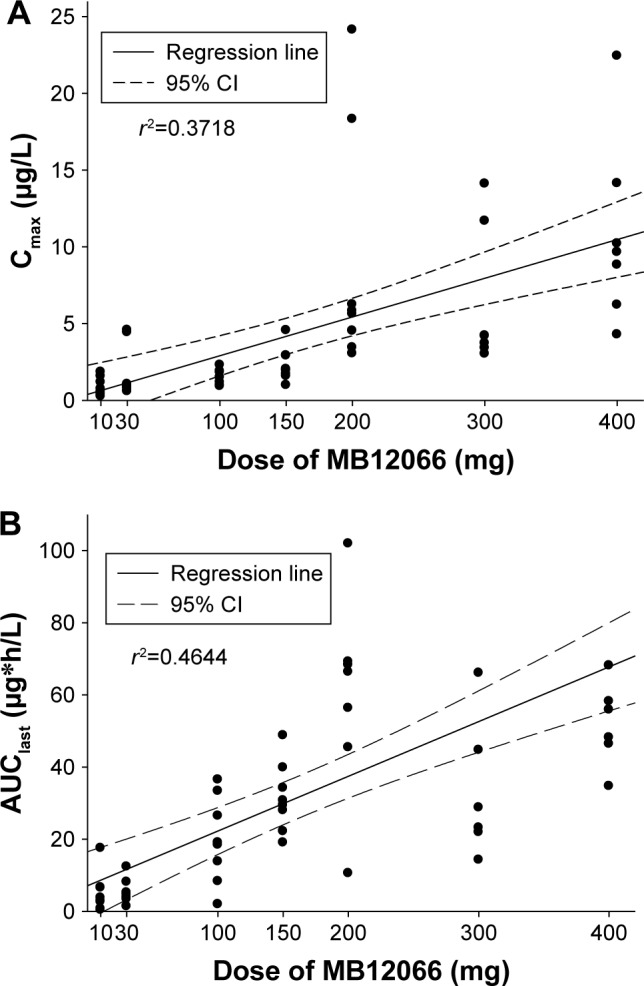
Relationship between individual (A) Cmax or (B) AUClast and doses after a single administration of MB12066.
Abbreviations: AUClast, area under the plasma concentration curve from time 0 to the last detectable time point; Cmax, maximum plasma concentration.