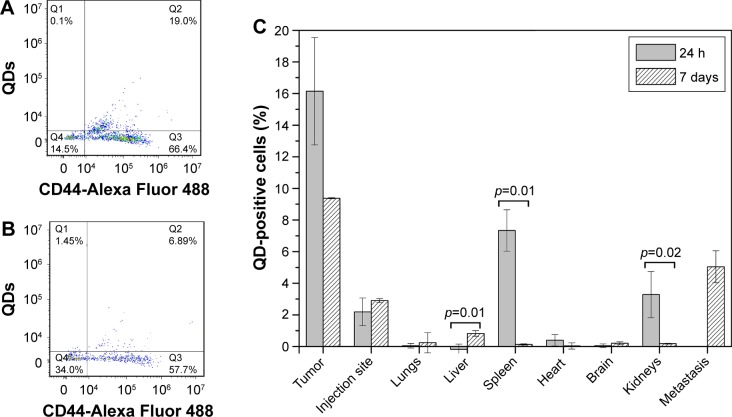
Figure 8.
In vivo migration of QD-loaded MSCs.
Notes: (A) Flow cytometry dot plot showing tumor homogenate stained with anti-CD44. (B) Flow cytometry dot plot showing metastasis homogenate stained with anti-CD44. Q3 quadrant shows human cancer cells, Q4 shows mouse cells, Q2 shows QD-loaded MSCs. (C) QD-positive cells found in the respective tissues. p-values show significant differences between 24 h and 7 days.
Abbreviations: MSCs, mesenchymal stem cells; QDs, quantum dots.

