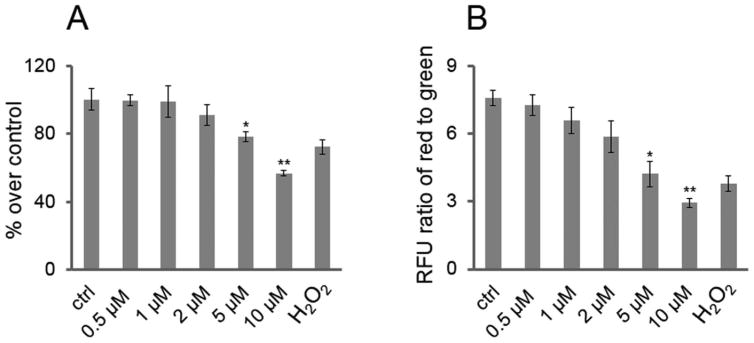
Figure 2.
EFV reduces NSC adenosine triphosphate (ATP) stores and mitochondrial membrane potential (MMP). (A) EFV reduces NSC ATP stores: NSCs were plated in 12-well plates with 3 × 10⁵ cells per well and treated with a series of concentrations of EFV, vehicle control (ctrl), and H2O2 (positive control; 100 μM) for 24 h. The relevant luminescence units (RLU) were measured for each condition. The percentages of treatment over ctrl represents intracellular ATP levels of NSCs. Each bar is presented as mean ± SEM (*p < 0.05; **p < 0.01). (B) EFV reduces MMP of NSCs: After NSCs were treated with a series of concentrations of EFV, vehicle control (ctrl), and H2O2 (positive control; 100 μM) for 6 h, they were incubated with JC-1 to detect MMP. The ratio of red fluorescence (RFU) to green fluorescence (RFU) represents the value of MMP. Data are presented as mean ± SEM (*p <0.05; **p < 0.01).

