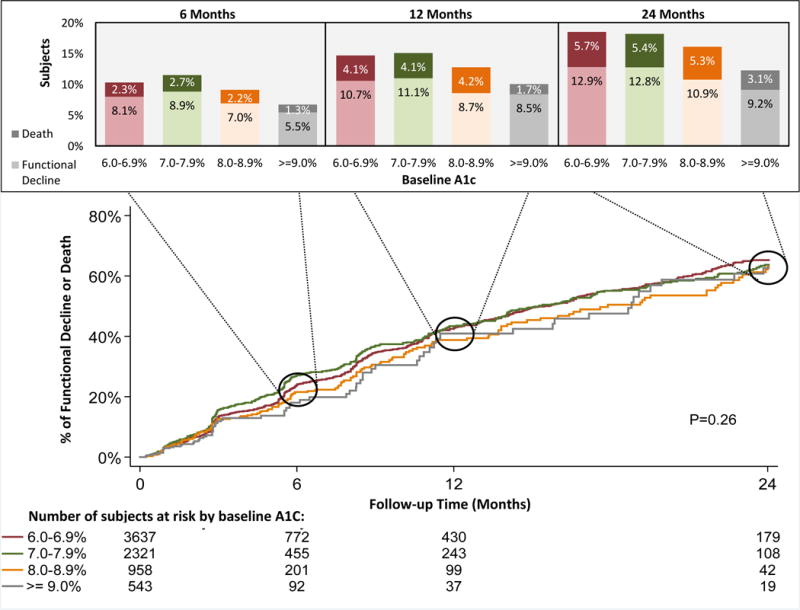
Figure 1. Survival Curves for Functional Decline or Death by baseline A1C Value.

*Kaplan-Meier figure accounts for censoring while the bar graphs do not, so the percentage with outcome differs between the Kaplan-Meier figure and bar graphs.

*Kaplan-Meier figure accounts for censoring while the bar graphs do not, so the percentage with outcome differs between the Kaplan-Meier figure and bar graphs.