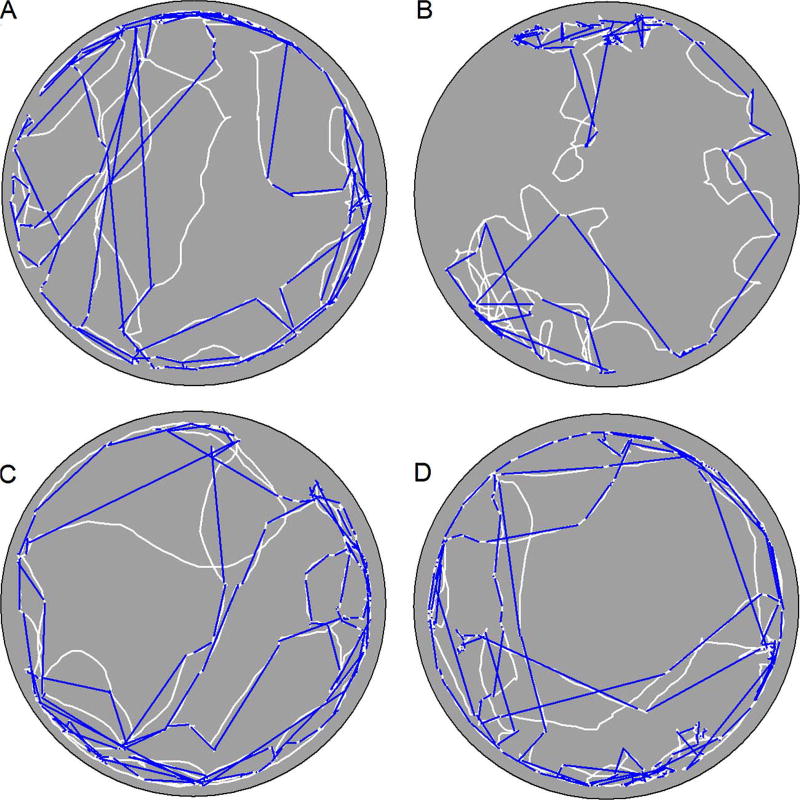
Fig. 2.
Representative paths (white lines) from one sample under dark conditions are plotted for a heterozygous mouse treated with ASO-C (panel A), an Usher mouse treated with ASO-C (panel B), a heterozygous mouse treated with ASO-29 (panel C), and an Usher mouse treated with ASO-29 (panel D). Euclidean distance or the shortest path between the start and end point of a progression (blue lines) is plotted for all progressions. (For interpretation of the references to colour in this figure legend, the reader is referred to the web version of this article.)

