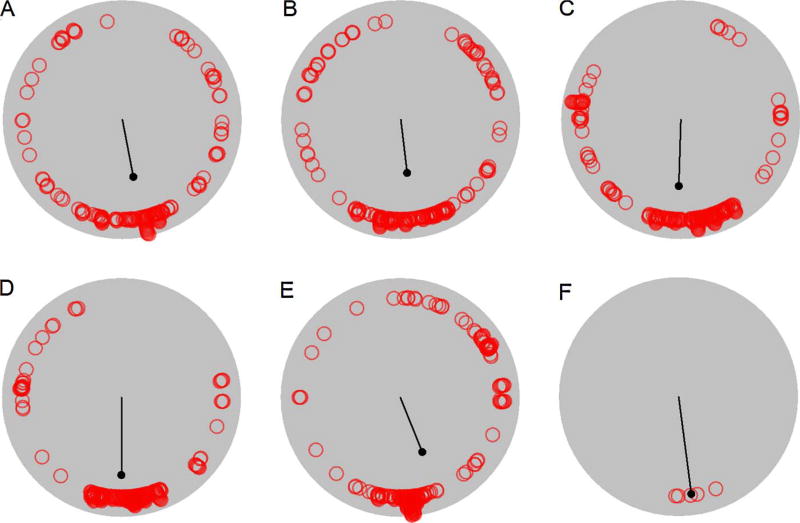
Fig. 6.
Stops (red circles) and first order circular statistics (black line) are plotted for a representative heterozygous mouse from the first (panel A), second (panel B), third (panel C), fourth (panel D), and fifth (panel E) samples. Average heading (red circles) and second order circular statistics (black line) are plotted for the five samples (panel F). (For interpretation of the references to colour in this figure legend, the reader is referred to the web version of this article.)

