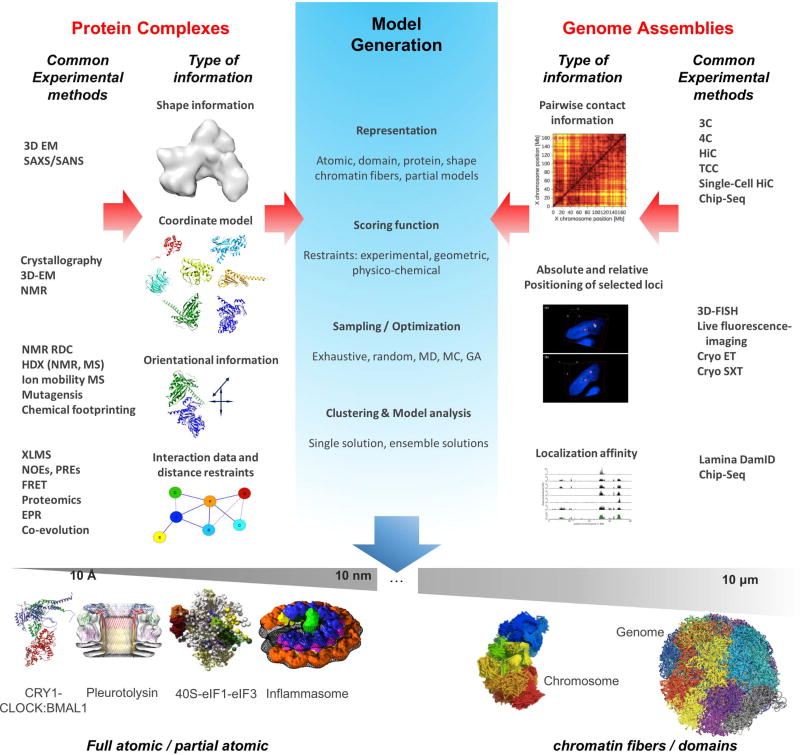
Figure 1.
Top: Examples of different types of information from various experimental sources that are integrated for structure determination of protein complexes and genome assemblies. The important steps involved in integrative modeling process are highlighted in the central panel (model generation).
Bottom: Examples of recently-determined integrative models of cellular assemblies across resolution and size scales (from sub-nanometer to ~10 micron range). From left to right: transcription repressive complex CLOCK:BMAL1 (brain and muscle Arnt-like protein 1) bound to CRY1 (cryptochrome-1) (adapted from [78]), atomic model built based on data from SAXS, NMR, Size Exclusion Chromatography and X-ray crystallography; structure of the fungal toxin Pleurotolysin (adapted from [38]), model built based on 11 Å resolution cryo EM map and X-ray crystallography; model of 40S-eIF1-eIF3 complex built using data from, XL-MS and X-ray crystallography (~25 Å negative stain EM map used for validation) (adapted from [9]); model of flagellin-induced NAIP5/NLRC4 inflammasome built based on data from 4nm resolution subtomogram average and X-ray crystallography (adapted from [79]); Ensemble of mouse X chromosome conformations from single cell HiC at 500kb resolution (adapted from [74]); example of a genome model for haploid mouse embryonic stem cells from HiC experiments using chain particles representing 100kb DNA (adapted from [75]).

