
Figure 2.
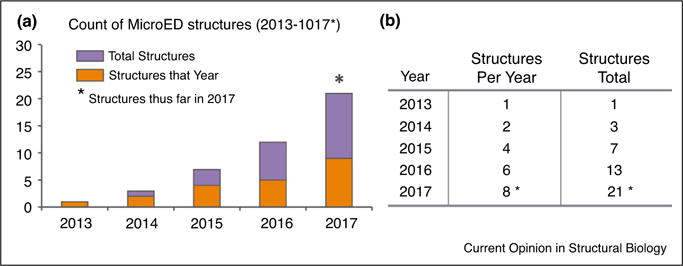
MicroED structures determined by year from 2013 to 2017. (a) Bar graph indicating the number of protein structures determined by MicroED on an annual basis. (b) A table summarizes the data presented (a), counting both the number of structures per year and the total structures to date per year. An asterisk marks 2017 indicating the count for the year is incomplete and includes only structures published at the start of the year.