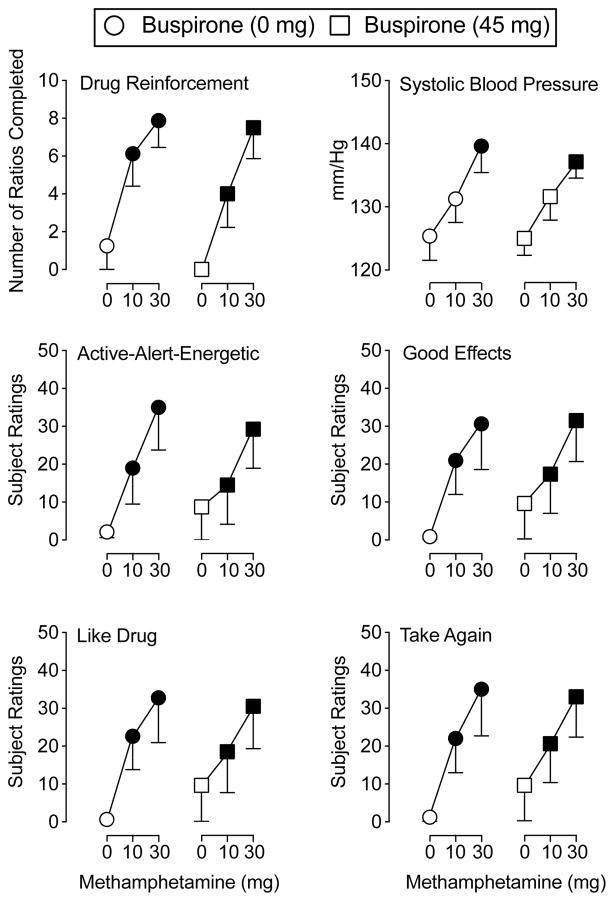
Figure 2.
The top left panel illustrates the number of ratios completed for methamphetamine (top left panel) during buspirone maintenance. The remaining panels demonstrate the peak effects of the sampling doses of methamphetamine during buspirone maintenance on systolic blood pressure (top right panel), and subject ratings of Active-Alert-Energetic (middle left panel), Good Effects (middle right panel), Like Drug (bottom left panel), and Willing to Take Again (bottom right panel). The X-axis represents methamphetamine dose. For all panels, circles represent 0 mg buspirone and squares represent 45 mg buspirone. Filled symbols indicate a significant difference from placebo using Fisher’s LSD post hoc test. Error bars represent standard error of the mean. N = 8 for all data points.

