Fig. 1.
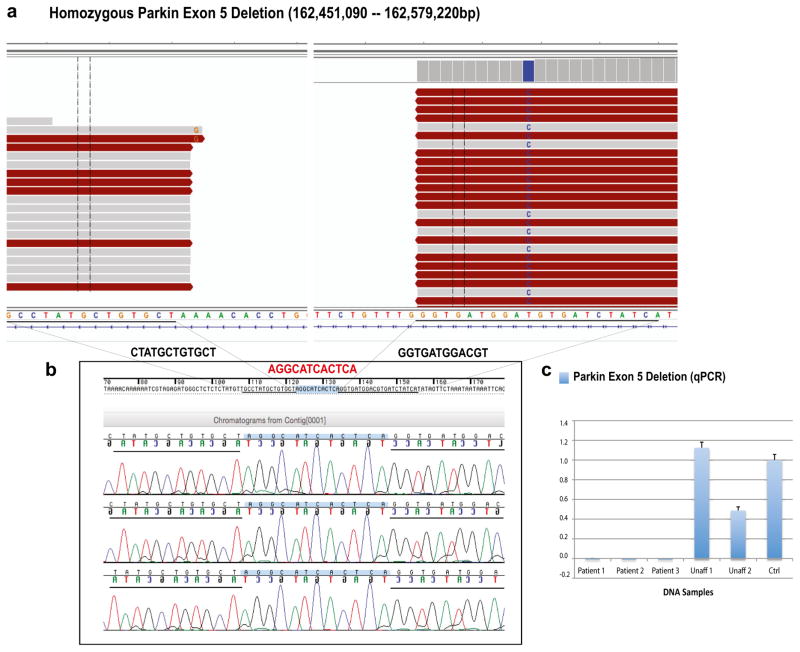
Parkin exon 5 deletion (128-kb). a WGS reads were visualized by using the Integrative Genomics Viewer (IGV). Two different plots that represent the Parkin exon 5 deletion breakpoints are shown. b Sanger chromatograms of the three affected individuals, who carried the 128-kb Parkin exon 5 deletion, are shown. Deletion breakpoints are highlighted in black (12 bp of the flanking regions), while the 12-bp insertion identified within the deletion breakpoints is highlighted in red. c Validation of the Parkin exon 5 deletion through qPCR analyses. Y-axis represents PRKN/GPR15 ratios; x-axis: DNA samples analyzed. Affected individuals showed no copy of Parkin exon 5 (ratio = 0.0), whereas unaffected individuals showed either two copies (Unaff 1; ratio = 1.0–1.2) or one copy (Unaff 2; ratio = 0.4–0.6). Unaff unaffected family member, Ctrl control DNA sample (color figure online)

