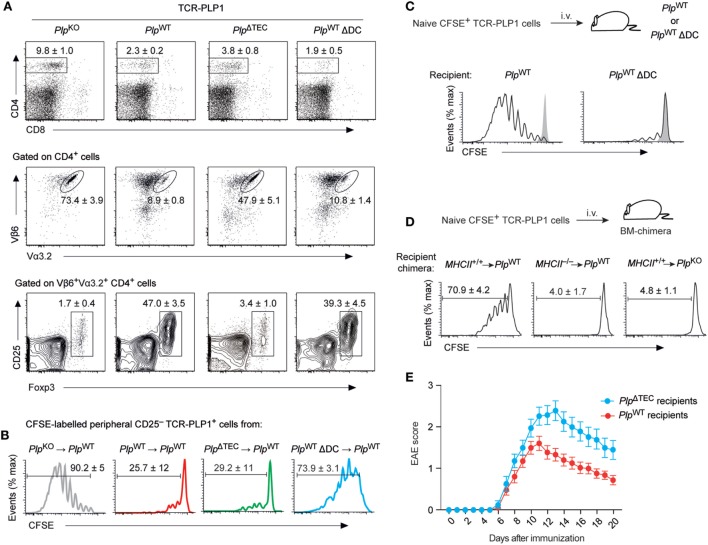
Figure 7.
Phenotype and functionality of TCR-PLP1 cells in PlpΔTEC and Δdendritic cell (DC) mice. (A) Peripheral phenotype of TCR-PLP1 transgenic mice on PlpKO (n = 8), PlpWT (n = 9), PlpΔTEC (n = 3), or PlpWT ΔDC (n = 7) background. The average frequency ± SEM of CD4 T cells (upper plot), TCR-PLP1+ cells (Vα3.2+Vβ6+) among gated CD4 T cells (middle) and CD25+Foxp3+ cells among gated TCR-PLP1+ CD4 T cells (lower) are indicated. (B) Purified TCR-PLP1+CD25– CD4 T cells from TCR-PLP1 mice on PlpKO, PlpWT, PlpΔTEC, or PlpWT ΔDC background (all CD45.2) were labeled with CFSE and injected i.v. into PlpWT (CD45.1) recipients. Three days after transfer, lymph node cells were harvested and CFSE dilution was assessed on gated CD45.2+ cells. Data are representative of n ≥ 4. (C) Purified TCR-PLP1+CD25–CD4 T cells from TCR-PLP1 mice on PlpKO background (CD45.1) were labeled with CFSE and injected i.v. into PlpWT or PlpWT ΔDC recipients (CD45.2). Three days after transfer, lymph node cells were harvested and CFSE dilution was assessed on gated CD45.2+ cells. The gray histogram shows the CFSE-intensity of cells transferred into control PlpKO recipients. Data are representative of n ≥ 6. (D) Purified TCR-PLP1+ CD4 T cells from TCR-PLP1 mice on PlpKO background (CD45.1) were labeled with CFSE and i.v. injected into bone marrow (BM)-chimeric recipients (MHCII+/+ → PlpWT controls, MHCII–/– → PlpWT, and MHCII+/+ → PlpKO) (CD45.2). Three days after transfer, lymph node cells were harvested and CFSE dilution was assessed on gated CD45.2+ cells. (E) Experimental autoimmune encephalomyelitis (EAE) disease course in male PlpWT or PlpΔTEC mice (non-TCR-transgenic) that had been injected i.v. with 5 × 10⁶ TCR-PLP1+ T cells from TCR-PLP1 PlpKO mice 6 h before administration of PLP9–20 in CFA. Data are from n ≥ 14 each.

