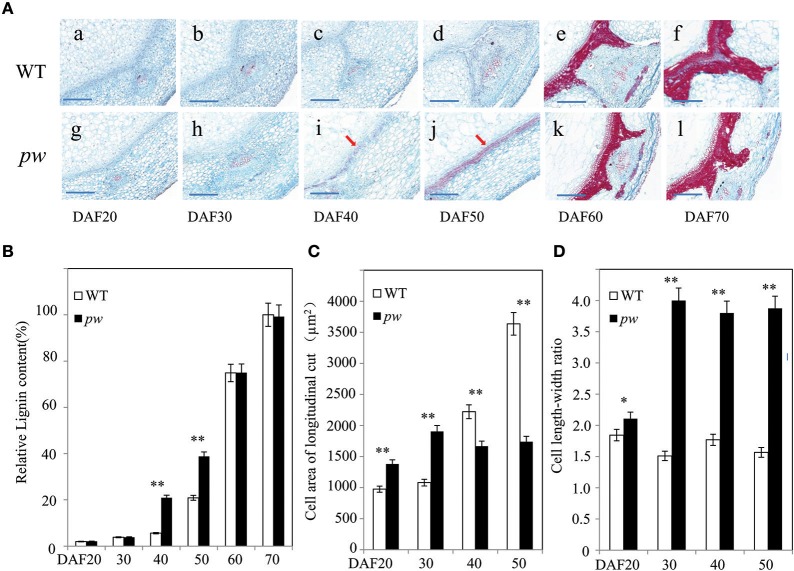
Figure 3.
Differences in cell development and in the hull lignification process between the pw and WT lines. (A) Changes in lignin content and cell area during pod development in the pw and WT lines. (a–f) Detection and localization of lignin content at six different WT developmental stages. Scale bars are 200 μm. (g–l) Detection and localization of lignin content at six different pw developmental stages. Scale bars are 200 μm. (B) Relative lignin content of pw and WT lines at six different developmental stages. (C) Cell area of longitudinal cut in pw and WT lines at six different developmental stages. (D) Cell length–width ratio in pw and WT lines at six different developmental stages. Significant differences were analyzed on the basis of three biological replications (t-test: *P < 0.05; **P < 0.01). Values in (B–D) are means ± SE (n = 3). Scale bars are 200 μm in (A). The arrows indicate lignified mesocarps.

