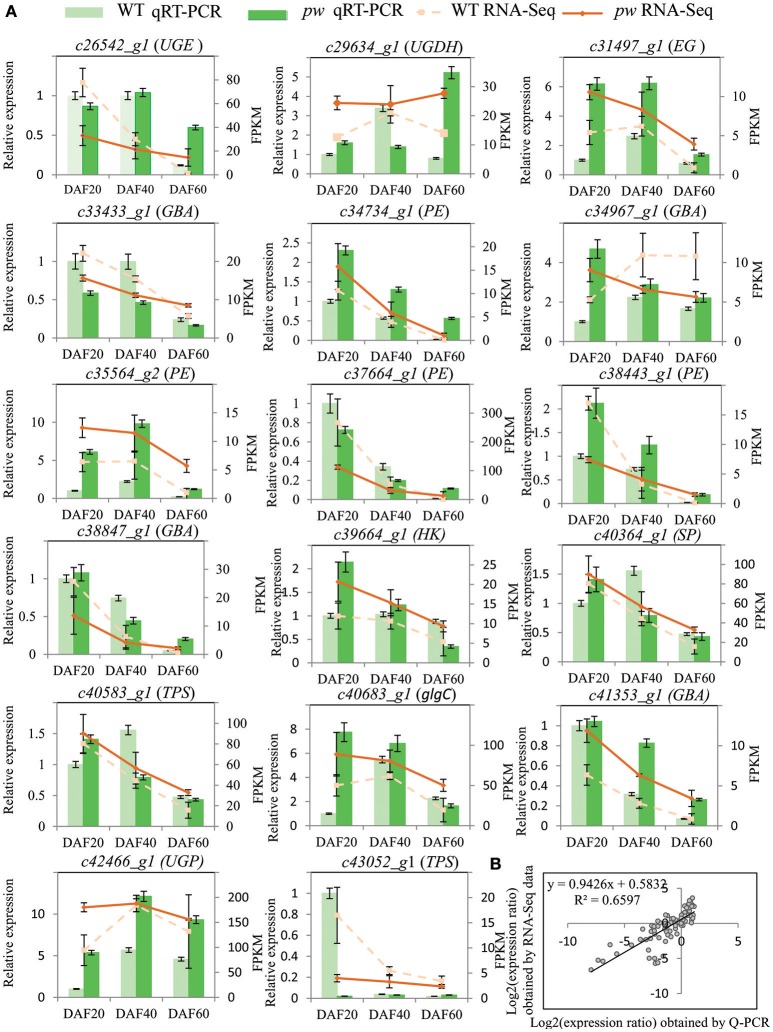
Figure 6.
qRT-PCR verification of DEGs between pw and WT lines. (A) Transcript levels of 17 genes with average FPKM value ≥2. The y-axis shows the relative gene expression levels analyzed with qRT-PCR and RNA-Seq. Results of WT qRT-PCR (green columns) and pw qRT-PCR (dark green columns) correspond with qRT-PCR expression data, while WT RNA-Seq (broken lines) and pw RNA-Seq denote RNA-Seq data. Data are means of three repeats in all cases, and error bars represent SE (n = 3). (B) Comparison of gene expression ratios from qRT-PCR and RNA-Seq data. UGE, UDP-glucuronate 4-epimerase; UGDH, UDPglucose 6-dehydrogenase; EG, endoglucanase; GBA, beta-glucosidase; PE, pectinesterase; SP, starch phosphorylase; TPS, trehalose 6-phosphate synthase; glgC, glucose-1-phosphate adenylyltransferase; UGP, UTP–glucose-1-phosphate uridylyltransferase. The RNA-Seq log2 value of the expression ratio (y-axis) has been plotted against the three different developmental stages considered in this study (x-axis).

