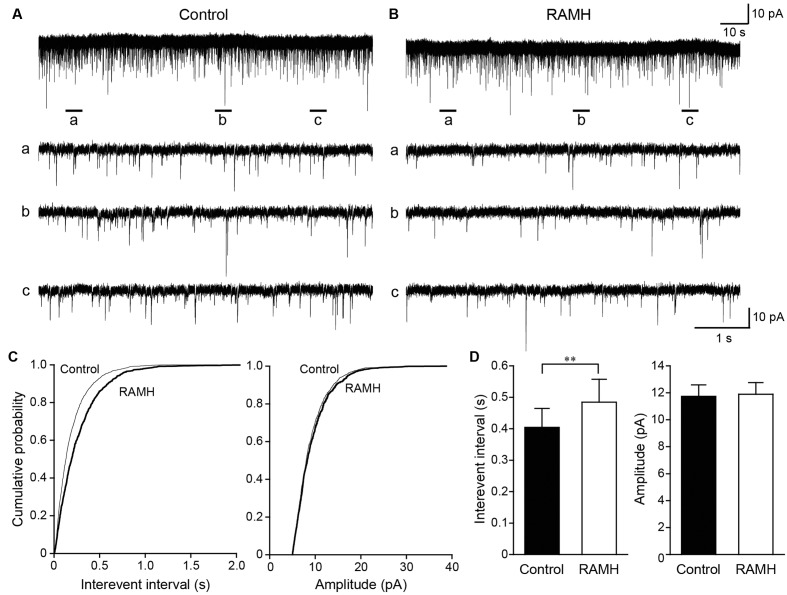
FIGURE 6.
The effects of 10 μM RAMH on miniature EPSCs (mEPSCs) recorded from insular cortex (IC) layer V pyramidal cells under the application of 1 μM TTX and 10 μM bicuculline. (A,B) An example of mEPSCs recorded before (A) and during the application of RAMH (B). The holding potential was set at –70 mV. Bottom panels (a–c) are time-expanded views of the regions indicated with bars under the top trace. (C) Cumulative probability plots of the interevent interval (left) and the amplitude of the mEPSCs (right) shown in (A,B). Note that RAMH (thick black lines) increased the interevent interval of mEPSCs without changing the amplitude. (D) Mean interevent interval (left) and the amplitude of mEPSCs (right) in controls and during RAMH application. RAMH increased the mIPSC interevent interval (∗∗P < 0.01, paired t-test).

