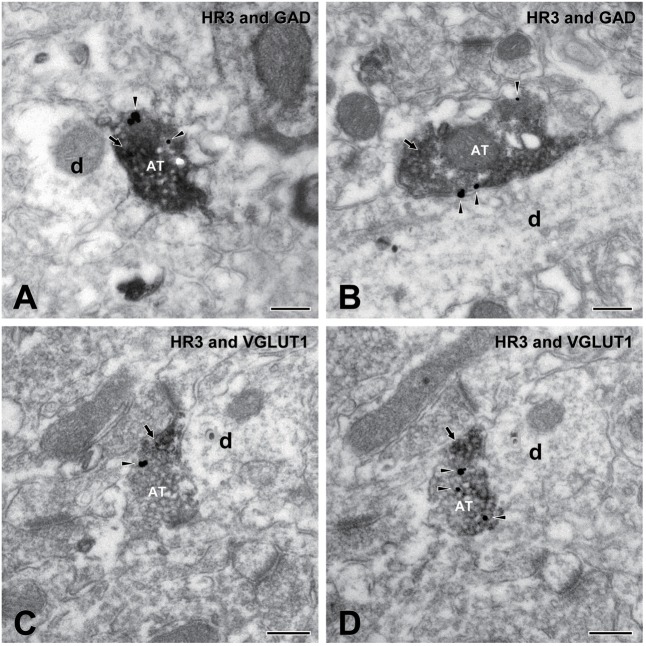
FIGURE 8.
Electron micrographs showing double immunostaining for H3 receptors and glutamic acid decarboxylase (GAD) and for H3 and vesicular glutamate transporter 1 (VGLUT1). (A,B) An axon terminal (AT) presynaptic to dendrite (d) shows immunoreactivity for both H3 receptors (silver-gold labeling, arrowheads) and GAD (immunoperoxidase labeling, arrow). (C,D) Electron micrographs of an AT in adjacent ultrathin sections: An AT shows immunoreactivity for both H3 receptors (silver-gold labeling, arrowheads) and VGLUT1 (immunoperoxidase labeling, arrow). Note the consistency of immunostaining in adjacent ultrathin sections of (C,D). Scale bar = 200 nm.

