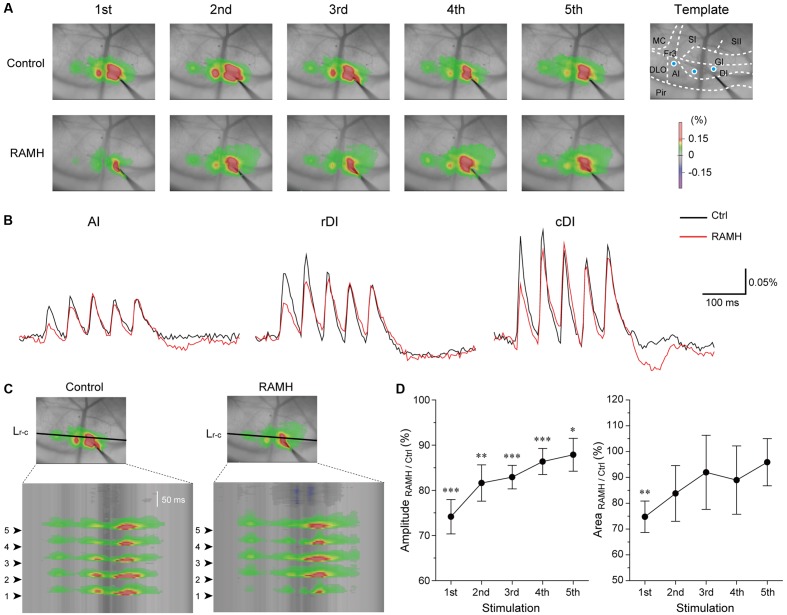
FIGURE 9.
Effects of RAMH on excitatory propagation induced by repetitive stimulation in the IC. (A) Color-coded optical signals induced by a train of 5 pulses at 20 Hz in control (upper panels) and during application of RAMH (10 μM). Note that RAMH suppressed optical signal amplitude response to the 1st stimulus but increased those to the 2nd to 5th stimuli proximal to the stimulation site. A template of cortical subdivisions of the IC and surrounding regions is shown in the right panel of control. Blue circles in the AI, the rostral DI (rDI) and the caudal DI (cDI) indicate the locations of regions of interest (ROIs). (B) Optical responses in AI, rDI, and cDI in control (black) and during RAMH application (red). The ROIs are shown in the top left panel of (A). (C) Spatiotemporal maps along the horizontal black line shown in the top panel at the 3rd in (A). Arrowheads on the left indicate the timing of electrical stimulation. Note that RAMH suppressed optical signals responding to the 1st stimulus. (D) Normalized amplitude and area of the effect of RAMH on excitatory propagation responding to the 1st to 5th stimuli. Note that RAMH-induced suppression of amplitude and area was prominent in the 1st response. AI, agranular IC; DI, dysgranular IC; DLO, dorsolateral orbital cortex; Fr3, frontal cortex (area 3); GI, granular IC; MC, motor cortex; Pir, piriform cortex; SI, primary somatosensory cortex; SII, secondary somatosensory cortex. ∗P < 0.05, ∗∗P < 0.01, ∗∗∗P < 0.001, paired t-test.

