
Figure 1.
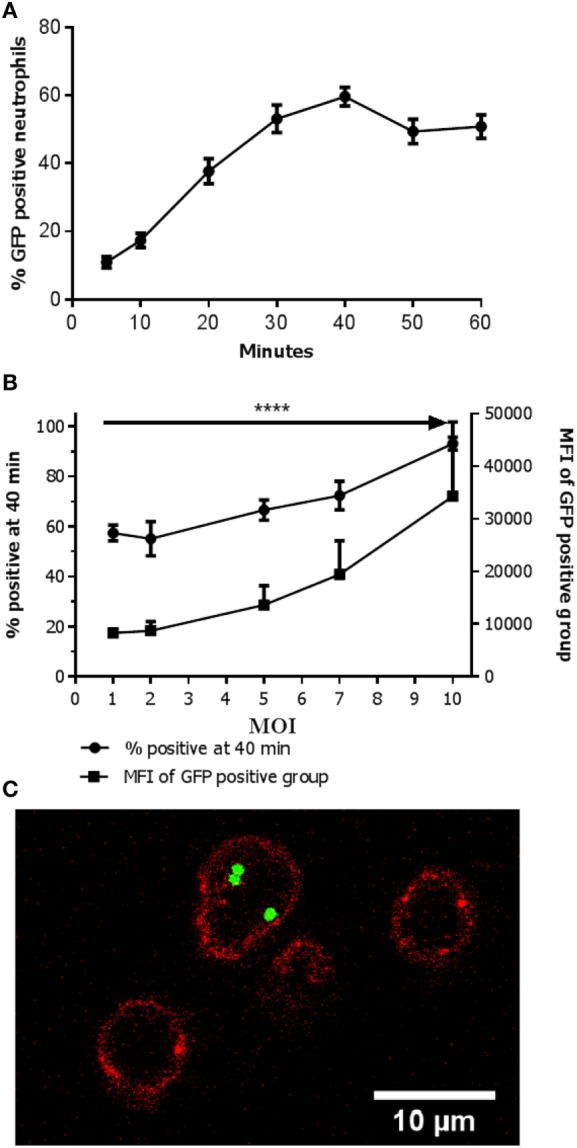
Active phagocytosis in only part of the neutrophils population. (A) Percentage of Staphylococcus aureus- green fluorescent protein (GFP)-positive neutrophils over time. The percentage of positive neutrophils is depicted when incubated with an MOI 1. A plateau is reached at 40 min. Data are presented as mean ± SEM [n = 17 (5 min), 15 (10 min), 17 (20 min), 13 (30 min), 29 (40 min), 10 (50 min), 12 (60 min)]. (B) Percentage of S. aureus-GFP-positive neutrophils with increasing MOI. The percentage of positive neutrophils in conditions with increasing MOI is depicted. An increase in the percentage of S. aureus-GFP-positive neutrophils as well as concurrent increase in mean fluorescence intensity (MFI) is observed (****P < 0.0001). Data are presented as mean ± SEM [n = 8 (MOI 1), 5 (MOI 2), 6 (MOI 5), 5 (MOI 7), 8 (MOI 10)]. Data were analyzed with one-way ANOVA. (C) Confocal image showing a neutrophil (cell membrane is visualized in red by staining of CD16-V500) with multiple intracellular bacteria (green, GFP), and two empty neutrophils.