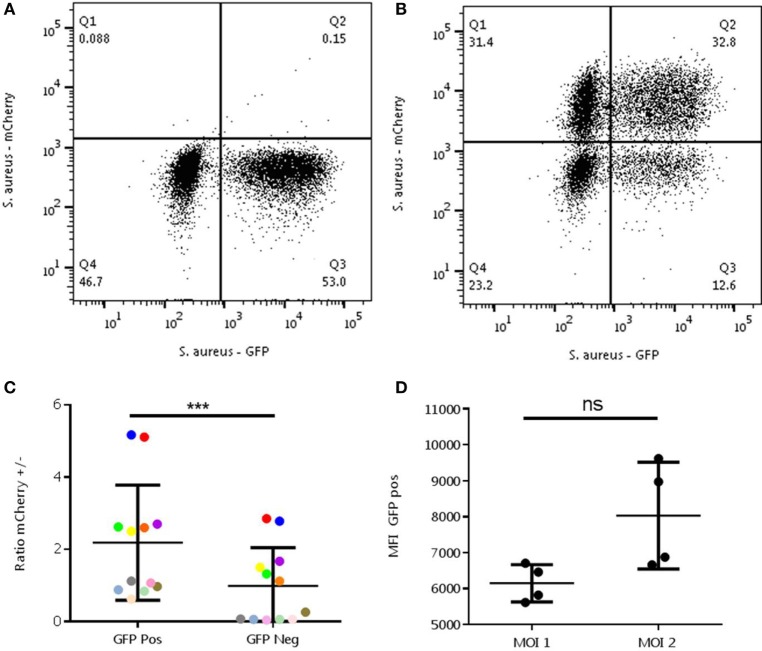
Figure 3.
Analysis of randomness in the interaction between Staphylococcus aureus- green fluorescent protein (GFP) and neutrophils. The experiment was performed with a MOI of 1 S. aureus-GFP in the first round (A) and with -mCherry in the second round (B). A representative experiment is shown. Ratios in the mCherry positive (/+) and negative cells (/−) were determined in the GFP-positive (+/) and negative (−/) (C) and MOI 1 and 2 (D) cells. (C) A relative enrichment of +/+ and −/− neutrophils is seen compared to the +/− and −/+ cells, which is not to be expected in a random process (***P = 0.0005). Differently colored dots represents results from the same experiments, different experiments can be executed with different MOIs. (D) An increase in mean fluorescence intensity can be observed in the mCherry positive group of the MOI 2 condition compared to a MOI 1 (ns, P = 0.125). Data were analyzed with the Wilcoxon test.

