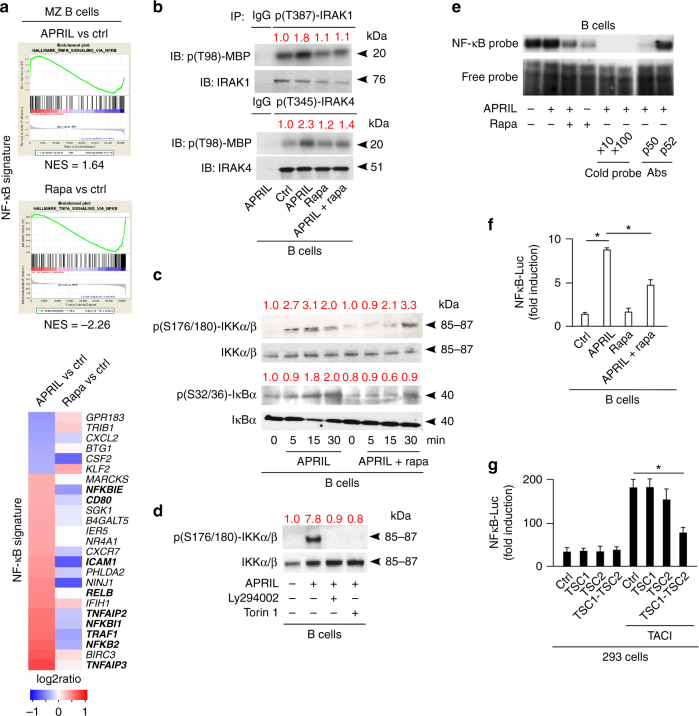
Fig. 4.
TACI activates the CSR-inducing transcription factor NF-κB through mTORC1. a GSEA showing enrichment or depletion of coordinated NF-κB gene sets from human splenic MZ B cells cultured for 3 h with or without APRIL or rapamycin (rapa). Ctrl, medium alone. NES indicates correlation between individual gene sets. Positive correlation, NES > 0; negative correlation, NES < 0. Heat map shows top 25 genes similarly enriched or depleted in MZ B cells exposed to different treatments. Colors correspond to significant FC expression: red (high); blue (low). Bold indicates genes discussed in the text. b IB of p(T98)-myelin basic protein (MBP), IRAK-1 and IRAK-4 following IP with anti-p(T387)-IRAK-1, p(T354)-IRAK-4, or irrelevant IgG of protein lysates from human 2E2 B cells cultured for 15 min with or without APRIL and/or rapamycin (rapa). Red numbers indicate band intensity relative to total proteins. c IB of total or p(S176/180)-IKKα/β and total or p(S32/36)-IκBα from human splenic IgD+ B cells incubated with APRIL in the presence or absence of rapamycin for 0, 5, 15, or 30 min. d IB of total or p(S176/180)-IKKα/β from human splenic IgD+ B cells incubated with or without APRIL in the presence or absence of Ly294002 or Torin 1 for 15 min. e EMSA of nuclear NF-κB bound to a radiolabeled κB DNA probe from human splenic IgD+ B cells incubated with APRIL in the presence or absence of rapamycin for 1 h (lanes 1–4). NF-κB–DNA interaction in the presence of increasing concentrations of a competing unlabeled cold probe (lanes 5–6) or blocking antibodies (Abs) to p50 and p52 NF-κB subunits (lanes 7–8) are also shown. f NF-κB-Luciferase (Luc) reporter assay of human EBV-transformed B cells incubated with APRIL in the presence or absence of rapamycin for 24 h. g NF-κB-Luc reporter assay of 293 cells expressing WT TACI with or without TSC1, TSC2, or both for 24 h. Ctrl, empty plasmid. Data summarize one representative experiment with at least three samples or biological replicates from each cell type (a, f, g), show one of at least three (b, d) or two (e) experiments with similar results. Error bars, s.e.m.; *p < 0.05 (two-tailed Student’s t test)

