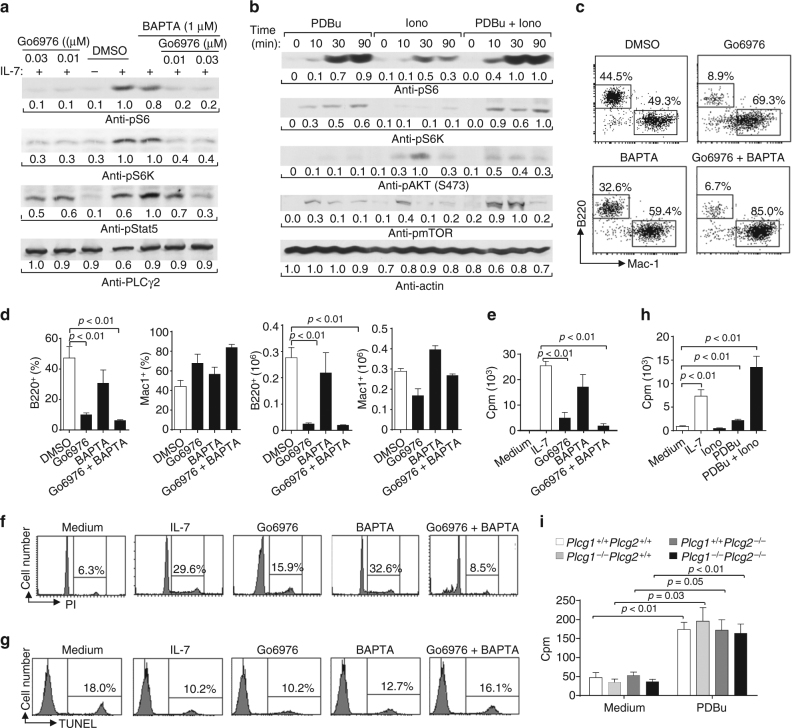
Fig. 7.
A major role of the DAG/PKC-dependent pathway in IL-7-mediated mTOR activation and functions. a Inhibition of the PKC pathway impairs IL-7-induced mTOR activation. Pro-B cells derived from Rag1-deficient BM were pre-treated with DMSO, Go6976, BAPTA, or Go6976 plus BAPTA, and stimulated with IL-7. Cell lysates were subjected to western blot analysis. b The PKC pathway activates mTOR in pro-B cells. Pro-B cells derived from Rag1-deficient BM were starved and stimulated with PDBu, ionomycin, or both. Cell lysates were subjected to western blot analysis. c, d Inhibition of the PKC pathway impairs IL-7-dependent B cell production. Lin− BM cells from wild-type mice were cultured on OP9 cells plus IL-7 for 1 day and then were treated with DMSO, Go6976, or Go6976 plus BAPTA. Numbers indicate percentages of B220+ and Mac-1+ cells in the gated live cells (c). Bar graphs show the percentages and numbers of B220+ and Mac-1+ cells (d). e–g Inhibition of the PKC pathway impairs IL-7-mediated B cell progenitor proliferation but not survival. Pro-B cells derived from Rag1-deficient BM were cultured without IL-7 (medium) or with IL-7 plus DMSO, Go6976 or Go6976, and BAPTA. Cell proliferation was determined by [3H] thymidine incorporation (e), cell-cycle analysis was performed by PI staining (f), and cell survival was measured by TUNEL staining (g). h PKC pathway activation induces B cell progenitor proliferation. Pro-B cells derived from Rag1-deficient BM were cultured without IL-7 (medium) or with IL-7, ionomycin (Iono), PDBu, or PDBu plus iono. Cell proliferation was determined by [3H] thymidine incorporation. i YFP+CD45.2+B220+CD43+CD24+ B cell progenitors were sorted from the congenic wild-type CD45.1+ recipients received Plcg1 +/+ Plcg2 +/+, Plcg1 −/− Plcg2 +/+, Plcg1 +/+ Plcg2 −/−, or Plcg1 −/− Plcg2 −/− BM, and cultured with or without PDBu. Cell proliferation was determined by [3H] thymidine incorporation. The number beneath each band in the western blot indicates the relative intensity of the corresponding band. Error bars show ± SEM. Data shown are obtained from or representative of 3 (a–d, f, g), 4 (i), and 6 (e, h) independent experiments

