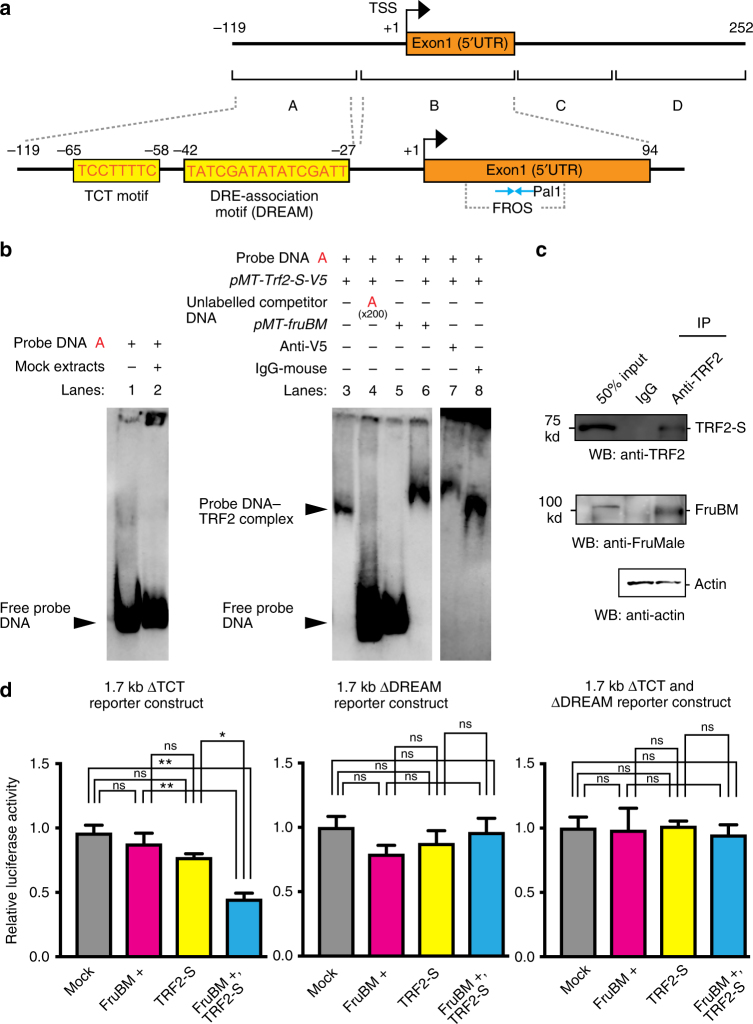
Fig. 5.
TRF2-S and FruBM interact with the robo1 promoter. a Upper panel: the map of the robo1 genomic region (upper line) and the positions of fragments A–D (lower line) used for electrophoretic mobility shift assays. Exon 1 is highlighted in orange. Transcription starts at the site and in the direction indicated by the arrow. Lower panel: the exon 1 and flanking regions with the TCT motif and DREAM are shown in an expanded scale. The location of FROS is indicated below exon 1. The two moieties of Pal1 as the core FruBM-binding motif are indicated by the blue arrows facing each other. The sequences composing the TCT motif and DREAM are indicated by red capitals. b Retarded migration of probe A was observed in the presence of S2 cell lysates expressing TRF2-S (TRF2-S[+] lysates, lane 3), but was not observed without lysates (lane 1) or with lysates expressing an empty vector (lane 2). The retarded band was diminished when an unlabeled probe A was added as a competitor (lane 4). Cell lysates expressing FruBM alone (FruBM[+] lysates, lane 5) did not yield any retarded band, whereas cell lysates expressing both TRF2-S and FruBM (TRF2-S[+]/FruBM[+] lysates, lane 6) did. The retarded band was supershifted when preincubated with a mouse anti-V5 antibody (lane 7), but not when preincubated with a mouse IgG antibody (lane 8). c Coimmunoprecipitation of TRF2-S and FruBM. Lysates from S2 cells co-transfected with Trf2-S and fruBM were subjected to immunoprecipitation with the anti-TRF2 antibody and analyzed by western blotting with the anti-TRF2 and anti-FruMale antibodies. Actin served as a loading control. d Luciferase reporter assays with the 1.7 kb robo1 promoter region lacking TCT (∆TCT), DREAM (∆DREAM), or both (∆TCT and ∆DREAM) in S2 cells transfected with the empty vector (Mock), fruBM alone (FruBM), Trf2-S alone (TRF2-S), or fruBM plus Trf2 (FruBM + TRF2-S). All experiments were conducted as triplicate and the mean ± SEM of relative luciferase activities are shown. Statistical differences were evaluated by one-way ANOVA followed by the Bonferroni’s multiple comparison test. **P < 0.01, *P < 0.05; ns not significant

