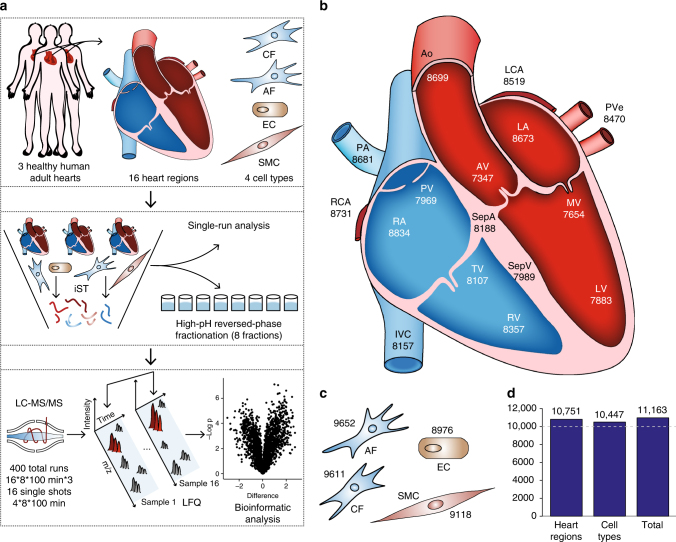
Fig. 1.
The quantitative landscape of the human heart proteome. a Experimental design, including the source of material (upper panel), in-depth vs. single-run analyses (middle panel), and schematic depiction of the analytical workflow (lower panel). b Graphical illustration of the human heart showing the total number of quantified proteins in each region. c Quantified proteins in three cardiac cell types and adipose fibroblasts. d Bar plot of the total number of quantified proteins in all heart regions, cell types, and the entire data set

