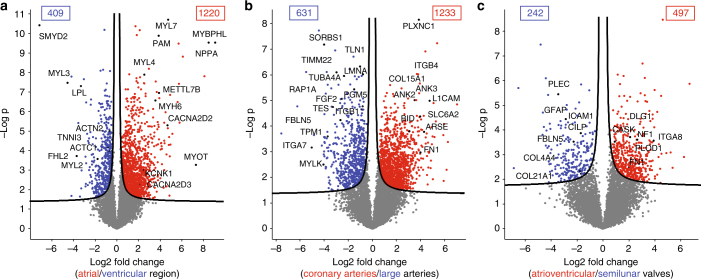
Fig. 4.
Proteins differentially expressed in human heart regions. Volcano plots of the p values vs. the log2 protein abundance differences between regions, with proteins outside the significance lines colored in red or blue (FDR < 0.05). p values are calculated from the data of three healthy hearts. a Ventricular (LV, RV, and SepV) compared to the atrial (LA, RA, and SepA) regions, b coronary arteries (LCA, RCA) compared to arteries (Ao, PA), and c semilunar (AV, PV) compared to atrioventricular (TV, MV) valves

