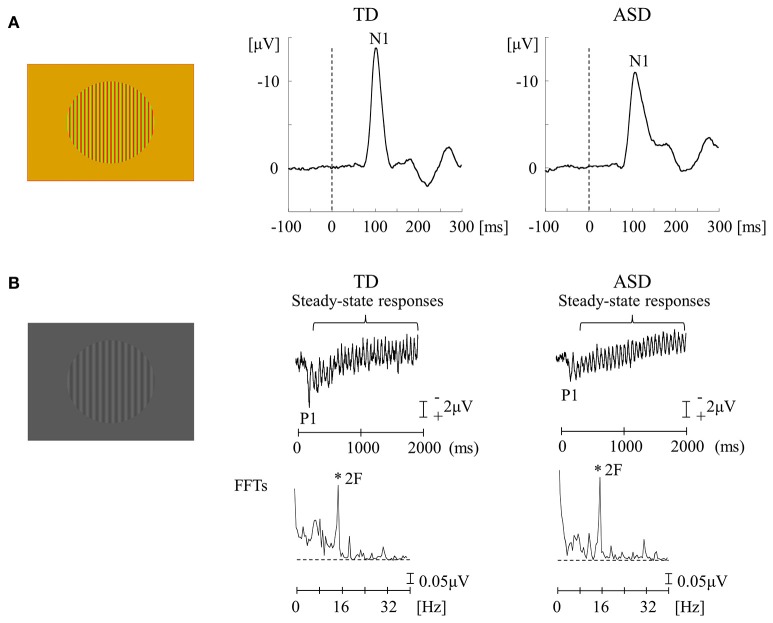
Figure 3.
VEPs in response to RG and BW stimuli in the TD and ASD groups. (A) For RG stimuli (isochromatic, SF: 2.0 cpd), the mean N1 latency in the ASD group was significantly longer than that in the TD group. (B) For BW stimuli [low-contrast (16.6%), SF: 1.0 cpd, 8 Hz (16 reversals/s)], there was no obvious difference in the distribution of P1 and steady-state responses between the two groups. VEPs, visual evoked potentials; RG, red/green; BW, black/white; TD, typically developing; ASD, autism spectrum disorder; cpd, cycles per degree; SF, spatial frequency; FFTs, fast Fourier transforms; 2F, second harmonic (Modified from Fujita et al., 2011 with permission).

