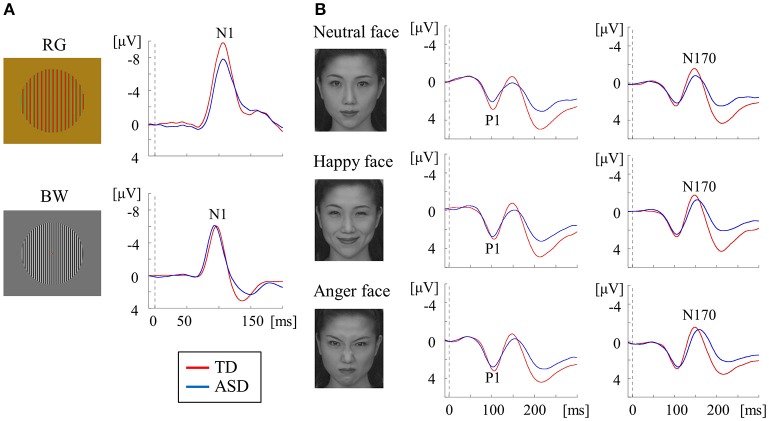
Figure 4.
VEPs in response to RG, BW, and face stimuli in the TD and ASD groups. (A) For RG stimuli (isochromatic, SF: 2.0 cpd), compared with the TD group, the mean N1 latency was significantly prolonged in the ASD group. In contrast, for BW stimuli [high-contrast (98.8%), SF: 5.3 cpd], the mean N1 latency was significantly shorter in the ASD group than in the TD group. (B) For face stimuli (neutral, happy, and angry faces), the mean P1 latency in the ASD group was significantly shorter than that in the TD group, regardless of facial expression, while the mean N170 latency was significantly longer in the ASD group than in the TD group (Modified from (Yamasaki et al., 2017) with no permission was required to reproduce).

