
FIGURE 3.
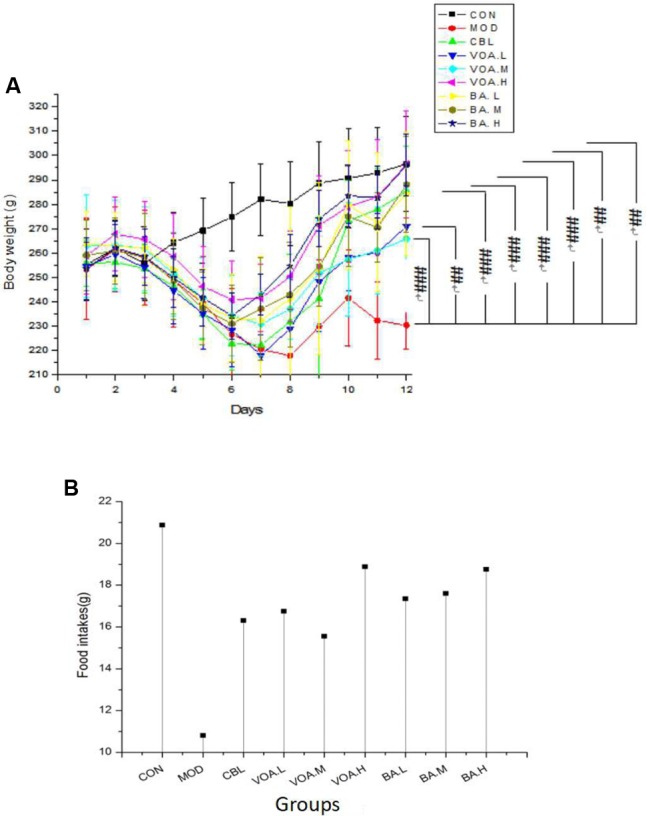
Weight changes (A) and mean food intake (B) across groups. Data were recorded daily, # significant difference compared to the model and controls at the end of the study. #p < 0.05, ##p < 0.01, and ###p < 0.001.
Official websites use .gov
A
.gov website belongs to an official
government organization in the United States.
Secure .gov websites use HTTPS
A lock (
) or https:// means you've safely
connected to the .gov website. Share sensitive
information only on official, secure websites.
Weight changes (A) and mean food intake (B) across groups. Data were recorded daily, # significant difference compared to the model and controls at the end of the study. #p < 0.05, ##p < 0.01, and ###p < 0.001.