
FIGURE 9.
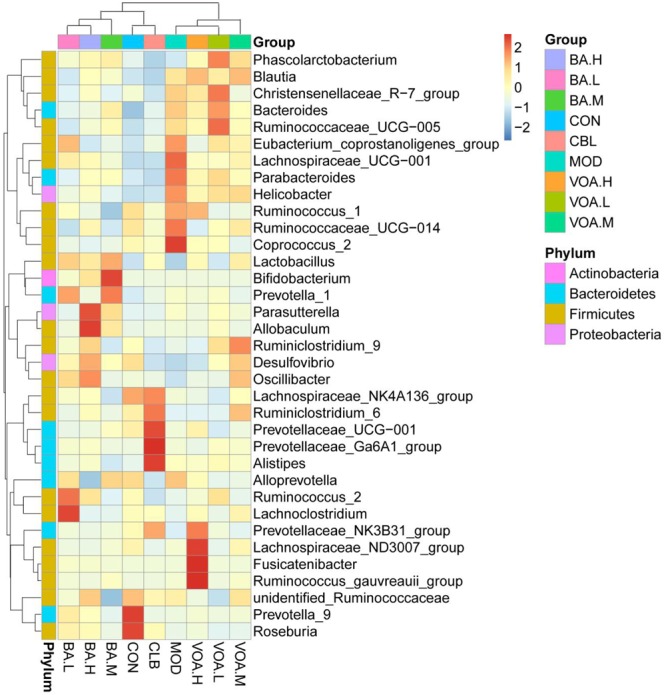
Species abundance clustering at the genus level. The X-axis represents sample information, the Y-axis represents annotation information for species, the clustering tree on the left is the species clustering, and the upper area is the sample clustering. Center values are Z-values standardized for species abundance in each line.