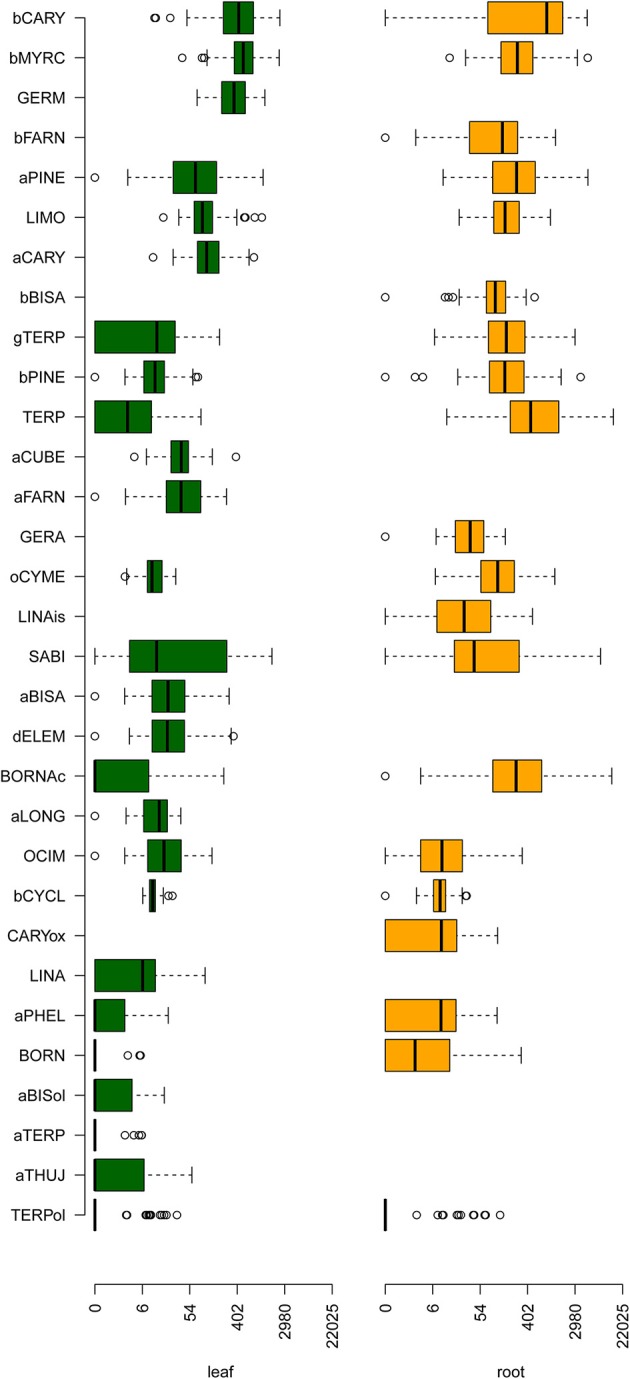
Figure 1.

Diversity of terpene contents in leaves and roots of 85 carrot cultivars. The left side of a box displays the 25% quartile, the bold line displays the median, the right side of a box displays the 75% quartile, whiskers indicate the variability outside the 25 and 75% quartile, while dots display outliers. The green boxes on the left side display the terpene contents in leaves, while the orange boxes display the terpene contents in roots. The terpenes are sorted according to the mean of the median content in leaves and roots. The x-axis displaying the terpene content is log1p-transformed. For abbreviated substance names, see Table 1.
