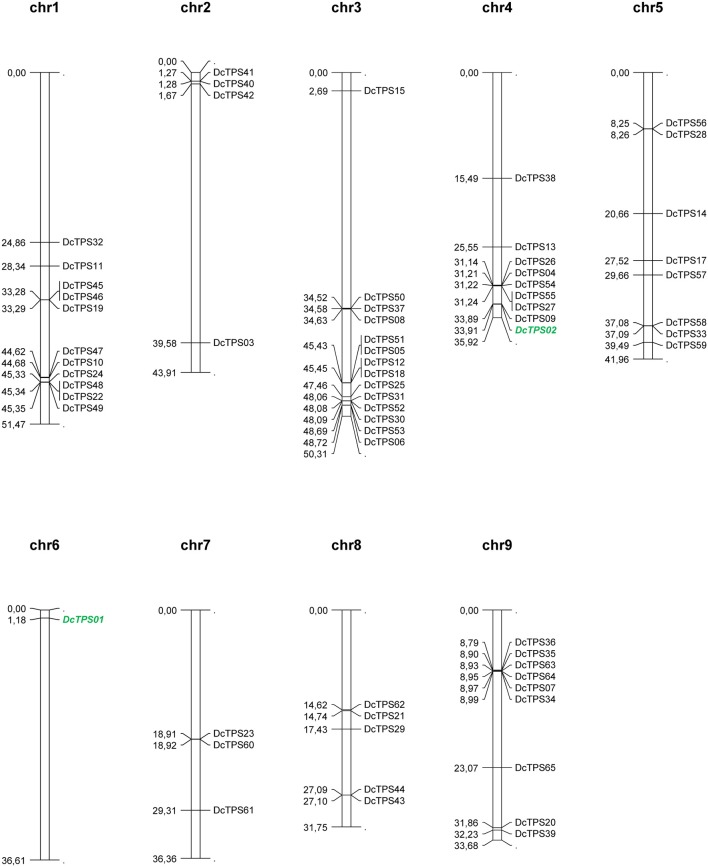
Figure 3.
Schematic map presentation of the genomic localization of the 65 carrot TPS genes listed in Table 3. Figures on the left side of the bars show the start position of the CDS of each TPS gene in Mb (mega base pairs). The software MapChart 2.2. (Plant Research International, Biometris, Wageningen, Netherlands) was used for map visualization. Known genes DcTPS01 and DcTPS02 (Yahyaa et al., 2015) are depicted in green bold letters.

