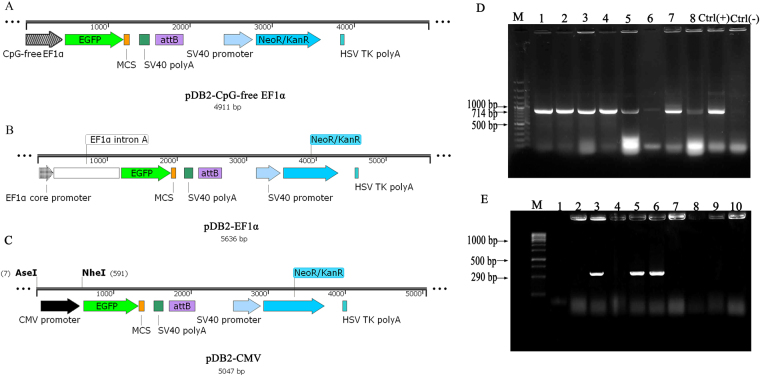
Figure 1.
Maps of donor vectors and analysis of specific integration in transfected clones. (A) pDB2 vector with CpG-free EF1α promoter. (B) pDB2 vector with EF1α promoter. (C) pDB2 vector with CMV promoter. The maps were designed by SnapGene 1.1.3 software. (D) EGFP coding sequence was amplified in different isolated clones by genomic PCR using EGFPF and EGFPR primers. In lanes 1–8, 714-bp bands confirmed the general integration of the donor vector in recombinant clones. (E) The second genomic PCR was designed to confirm the specificity of genomic integration using attBF and attBR primers. The lack of 290-bp band in recombinant clones (lanes 1, 2, 4, 7 and 8) established that phiC31 catalyzed the targeted integration between attB and pseudo-attP sites. M is DNA ladder 100 bp. Ctrl(+) is positive control in which PCR reaction was performed on pDB2 plasmid and Ctrl(−) is negative control in which PCR reaction was carried out on the genome of non-transfected cells. Electrophoretic gel images presented in this figure were full length.

