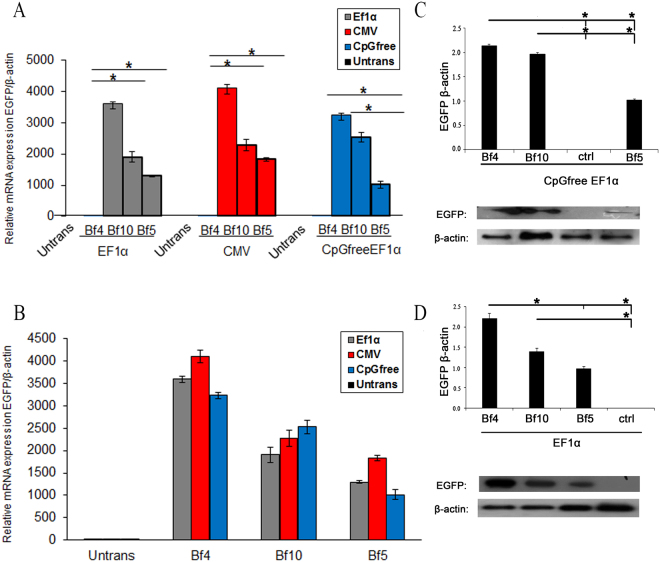
Figure 5.
Analysis of EGFP expression in transfected clones contained different integration sites and promoters. (A) Relative transgene expression was assessed for all promoters in three different integration sites using RT-qPCR. (B) Comparison of relative transgene expression in each integration site by different promoters (*P < 0.05 by ANNOVA and two way ANNOVA). Data presented as mean ± SEM of three separate experiments. (C) Western blot analysis for EGFP protein expression under control of CpG-free EF1α promoter in three integration sites. Quantitative analysis of western blot showed significant up regulation in EGFP expression in BF4 and BF10 compare to BF5 site. (D) Western blot analysis for EGFP expression under control of EF1α promoter in three integration sites. Quantitative analysis by western blot showed significant up-regulation in EGFP expression in BF4 compare to BF5 and BF10 sites (*P < 0.05 by paired samples t-test). Data presented as mean ± SEM; all reactions were carried out in three separate experiments. Western blot images shown in this figure were cropped; uncropped full length images are shown in the Supplementary Fig. S4.

