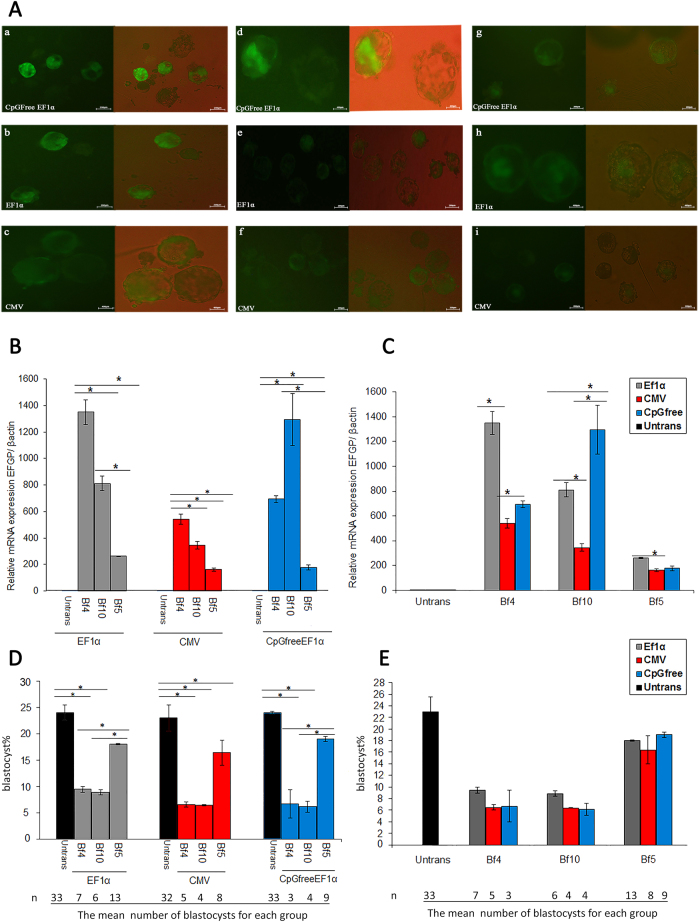
Figure 6.
EGFP expression in SCNT-derived blastocysts and blastocyst formation rate from transfected clones contained different integration sites and promoters. (A, a–c) Blastocysts obtained by SCNT from BF10-derived clones in which EGFP is under control of CpG-free EF1α, EF1α and CMV promoters. (d–f) Blastocysts obtained by SCNT from BF5-derived clones under control of three different promoters. (g–i) Blastocysts obtained by SCNT from BF4-derived clones under control of three different promoters. Scale bar = 200 and 400 μm. (B,C) EGFP Expression in three different transgenic clones under control of different promoters. *P < 0.05 means ± SEM of three separate experiments. (D) Blastocyst formation rate for any promoter in three different integration sites and the mean number of blastocysts for each group. (E) Comparison of blastocyst formation rate in three integration sites by different promoters (*P < 0.05 by ANNOVA and two way ANNOVA). Data are mean ± SEM; all reactions were carried out in triplicate for each clone.

