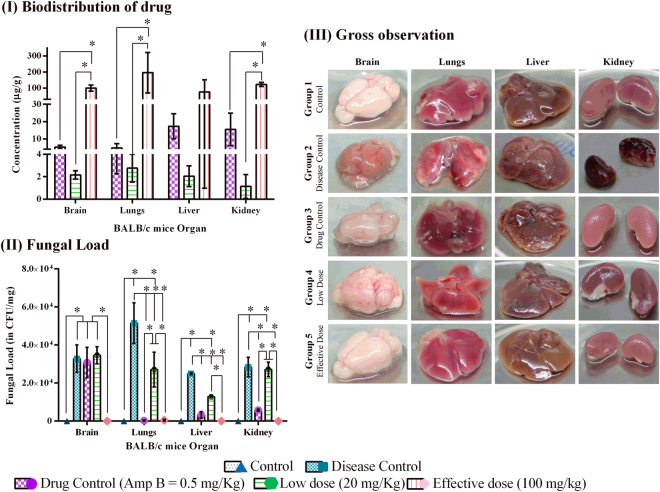
Figure 3.
(I) Biodistribution of compound-6 and AmpB: Concentration of compound-6 and AmpB in each organ was expressed in µg/g. (II) Fungal load: Fungal load was estimated in PDA plates. Absence of yeast colonies were observed in effective dose treatment group. (III) Gross observation of systemic organs of various study groups: Organ damage was observed in disease and low dose treated groups. Liver abnormality was recorded in AmpB treated. The organs were normal in effective dose treated group and were similar in appearance to that of control. Bar represents mean and SD for triplicates. *Represents p ≤ 0.05; comparison by One-way and two-way ANOVA followed by Tukey’s multiple comparisons test (Supplementary Table S4) and graphs were obtained using GraphPad Prism software.

